When Signals Connect Decisions Get Faster
Growth Compounds
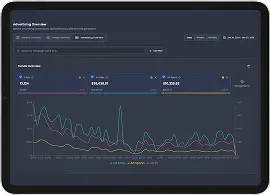
Unified Performance View connects Amazon, Shopify , and TikTok into one intelligence layer— so every advertising, pricing, and inventory decision is made with the full picture.
Most brands can see their revenue. Very few can see their profit — by product, by channel, by day . The gap between what the dashboard shows and what the business needs to decide is where growth breaks.
What Unified Performance View Is
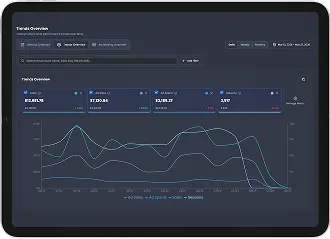
Not A Dashboard, A Decision Intelligence Layer
UPV aggregates signals from every channel Eva manages and surfaces them as actionable intelligence — so operators make faster decisions, advertisers allocate capital to the right SKUs, and leadership sees profit, not just revenue.
Signals
Amazon . Shopify TikTok . Ads . Inventory
Intelligence
Profit by SKU Channel contribution Blended ROAS
Decisions
Budget allocation Pricing Inventory pacing
Outcomes
Higher ROAS Lower TACOS Margin growth
What Unified Performance View Is
Five views that change how you run the business
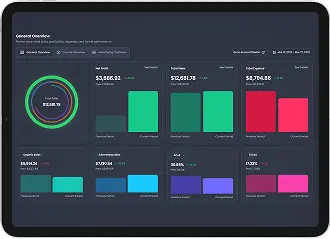
Profit Visibility
by SKU
Input COGS at product level. See contribution margin by SKU, by channel, and across the total business — not just revenue. Know which products are actually making money before you decide where to spend.
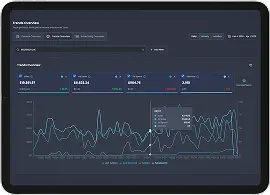
Blended Performance Across Channels
Blended ROAS, channel-level ad efficiency, and cross-channel contribution in one view. See how Amazon, Shopify, and TikTok interact — not as three dashboards but as one coordinated picture.
Product Portfolio Management
Tag and group products into portfolios. Analyze performance by category, strategy, or growth stage. Compare which clusters are driving margin vs. which are consuming it.
SKU-Level Intelligence Across Marketplaces
Variation-level tracking across every channel Eva manages. Identify top performers, underperformers, and ranking opportunities. Connect product performance to advertising allocation in real time.
Inventory-Aligned Demand View
See velocity, stock position, and ad spend side by side. Catch low-stock ASINs before spend scales on products that can’t fulfill demand. Align replenishment forecasts to advertising pacing.
What Changes When Data Is Connected
Smarter Decisions, Better Outcomes
Smarter Decisions
Budget allocation by performance and ranking stage
Campaign and keyword prioritization
Channel investment shifts based on contribution
Inventory aligned to demand velocity
Creative decisions driven by conversion signals
Better Outcomes
Higher ROAS and contribution profit
Reduced wasted ad spend
Faster reallocation to winning signals
Stronger LTV and repeat purchase rate
Revenue growth with margin control
Proven Results Across the Eva Growth System
Real outcomes from brands using Eva across Amazon, Shopify, and TikTok
Revenue Driven Across Channels
$1B+
Ad Spend Optimized with Profit Focus
$0.3B+
Avg. Profit Increase in 6 Months
0%
Reduction in Operational Costs
0%
Avg. Revenue Growth in 6 Months
0%
Based on aggregated performance across Eva-managed brands
Results
What Visibility Actually Changes
SKU-level profit
visibility
Scale what’s working. Stop funding what isn’t.
Margin clarity by product
Cross-channel blended
view
Faster budget reallocation to highest-performing channels.
Reduced wasted spend
Inventory-aligned
advertising
Ad spend matched to stock position before scaling.
Prevented rank collapse
Portfolio-level analysis
Compare strategies, not just products.
Clearer catalog prioritization
Connected signals
Operators act on full-picture data, not siloed reports.
Eva helped us align our Amazon operations across the US and Japan into one system. By connecting advertising, content, and inventory, we gained better visibility and control over performance. This allowed us to improve conversion, stabilize operations, and scale more efficiently across both markets.
Teruhiro Kawabe
Chief Marketing Officer
Eva brought structure and intelligence to our Amazon advertising. By combining AI-driven optimization with expert execution, we were able to double our ad sales within six months while maintaining strong return on spend.
Tina Fichera
VP of eCommerce, The Cricket Company
I see Eva as the system that connects demand, ranking, and conversion across Amazon, Shopify, and TikTok. Their combination of AI and expert operators has significantly increased our visibility while improving profitability.
Juliette Fasset
CEO, Happy Products Inc.
“Eva helped us turn TikTok into a real revenue engine, not just a content channel. What changed was the structure. Creator activity became measurable, scalable, and directly tied to revenue. We moved from unpredictable spikes to consistent growth.”
Beth Milligan
Operations Director, Drybar
Eva enabled us to unify Amazon advertising, data, and execution into one system. This allowed us to scale demand efficiently while maintaining strong control over profitability across markets.
A dashboard shows metrics. Unified Performance View is built to help operators decide where to allocate budget, which products to scale, and what to fix first.