Table of Contents
- The Question Every Brand Manager Is Asking Right Now
- The Core Difference That Changes Everything
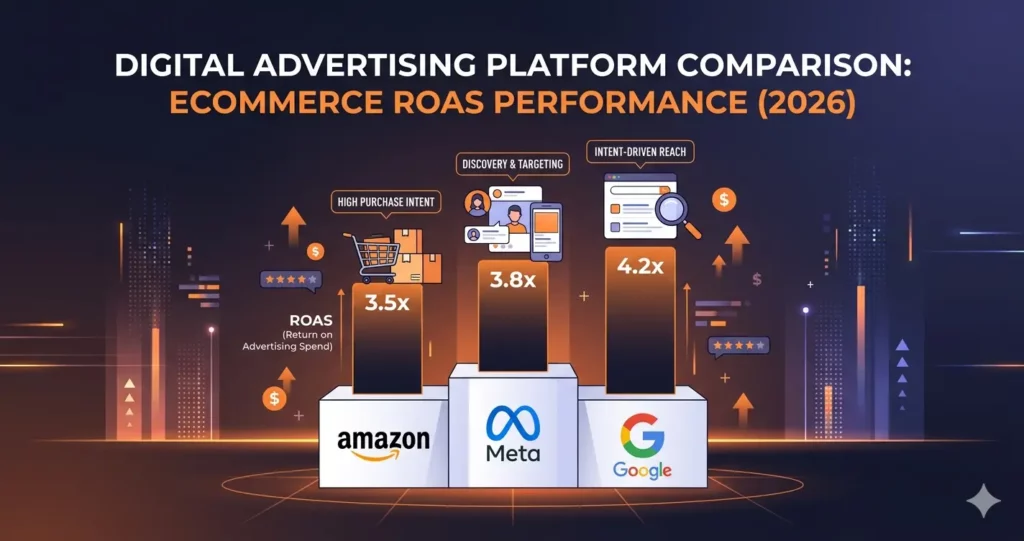
- ROAS Benchmarks: The Real Numbers for Each Platform
- Breaking Down Each Platform for Amazon Brands
- Head to Head: Amazon DSP vs Meta vs Google
- Why ROAS Comparisons Between Platforms Are Often Misleading
- Budget Allocation: A Practical Framework for Amazon Brands
- Which Platform Wins for Each Specific Goal
- The Bigger Picture: Why Retail Media Is Winning Budget From Social and Search
- Frequently Asked Questions
- The Bottom Line
The Question Every Brand Manager Is Asking Right Now
I get this question in some form almost every week from brand managers who are spending on Amazon and starting to feel the pressure of rising CPCs. ‘Should we be putting more into Meta? Should we be running Google Shopping? How does Amazon DSP actually compare?’
It’s a fair question, and the honest answer is that there’s no single platform winner. But there is a logical framework for thinking through which channels make sense for your goals, your budget, and your brand’s current position. That framework is what this article is about.
We’ll look at each platform on its own terms, compare ROAS benchmarks with real data, dig into the attribution differences that make those numbers hard to compare directly, and then give you a practical budget allocation approach that most established Amazon brands can actually use.
The Core Difference That Changes Everything
Before we look at ROAS numbers, there’s one concept that makes this whole comparison make sense. Each of these three platforms serves a fundamentally different stage of the buyer’s journey, and that difference drives everything from ROAS to creative strategy to attribution.
| Platform | Core Role | Buyer State | Primary Data Type |
| Meta Ads (Facebook/Instagram) | Demand creation — shows products to people who didn’t know they wanted them | Passive, browsing, not in buying mode | Social graph, interest, behavioural signals |
| Google Ads (Search/Shopping) | Demand capture — intercepts people actively searching for what you sell | Active, intent-driven, researching or ready to buy | Search query intent, keyword signals |
| Amazon DSP | Demand capture plus demand creation — reaches buyers on and off Amazon using purchase data | Range from in-market shoppers to past buyers | First-party purchase history, browsing, streaming behavior |
| Amazon Sponsored Ads (PPC) | Bottom-funnel demand capture — appears in search results on Amazon | High intent — actively searching on Amazon | Amazon keyword search data |
The simplest way to frame this: Meta interrupts people who weren’t looking. Google catches people who are looking. Amazon catches people who are ready to buy — and Amazon DSP does both, using purchase behavior rather than interest signals.
A data point that illustrates the difference in buyer intent: 71% of online shoppers begin product searches on Amazon, while 49% start on Google. That 22-point gap tells you where commercial purchase intent is concentrated.
ROAS Benchmarks: The Real Numbers for Each Platform
This is where most comparison articles either oversimplify or mislead. ROAS numbers look very different depending on campaign type, attribution window, and category. Here’s what the data actually says.
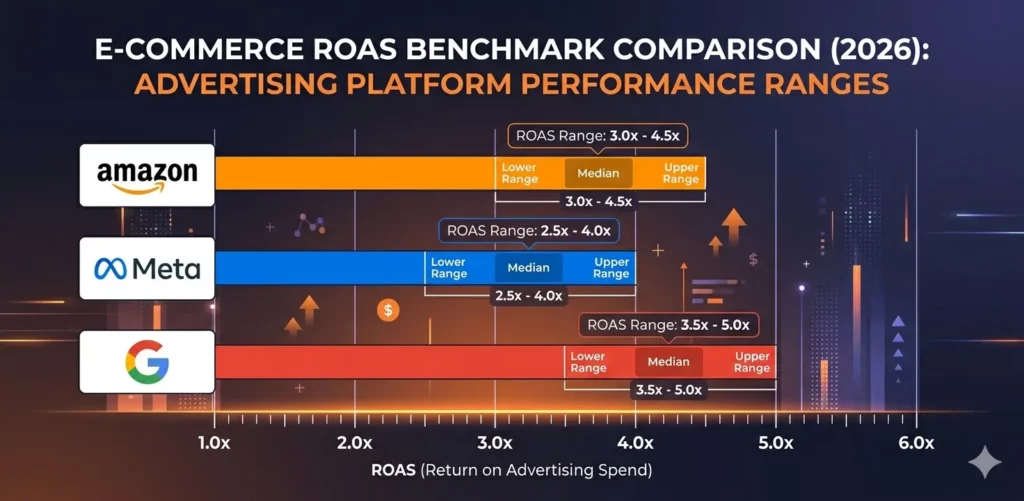
| Platform / Campaign Type | Reported ROAS Range (2025-2026) | Attribution Model | Notes |
| Amazon Sponsored Products | 4.1x average (ecommerce) | Last-click, 14-day window | Highest intent in the ecosystem — shopper is actively searching on Amazon |
| Amazon Sponsored Products (top brands) | 5.2x average | Last-click, closed-loop | Amazon’s closed-loop attribution is more reliable than Google/Meta for product sales |
| Amazon DSP — retargeting | 3x to 8x+ depending on audience warmth | View-through + click, 14-day | Cart abandoner retargeting regularly hits the high end. Prospecting sits lower. |
| Amazon DSP — prospecting | 1x to 3x direct ROAS | View-through + click, 14-day | Low direct ROAS is expected — the value shows in branded search lift and NTB customers |
| Google Shopping | 4.0x to 7.5x average | Last-click (default) | High ROAS reflects search intent. Retail & ecommerce vertical median is closer to 3.0x. |
| Google Search — branded | 8x to 20x+ | Last-click | Branded search captures demand built by other channels. Partly attributional. |
| Google Search — non-branded | 5.21x median incremental ROI | Incrementality-adjusted | Cassandra App 2026 analysis — lower than platform-reported ROAS due to real attribution |
| Meta Ads — blended | 2.5x to 4.0x average | Post-impression, 7-day click / 1-day view | Strong for discovery and upper-funnel. Retargeting on Meta hits 7.1x average. |
| Meta Ads — retargeting | 7.1x average | Post-impression attribution | DPA retargeting is Meta’s highest-ROAS format for ecommerce brands |
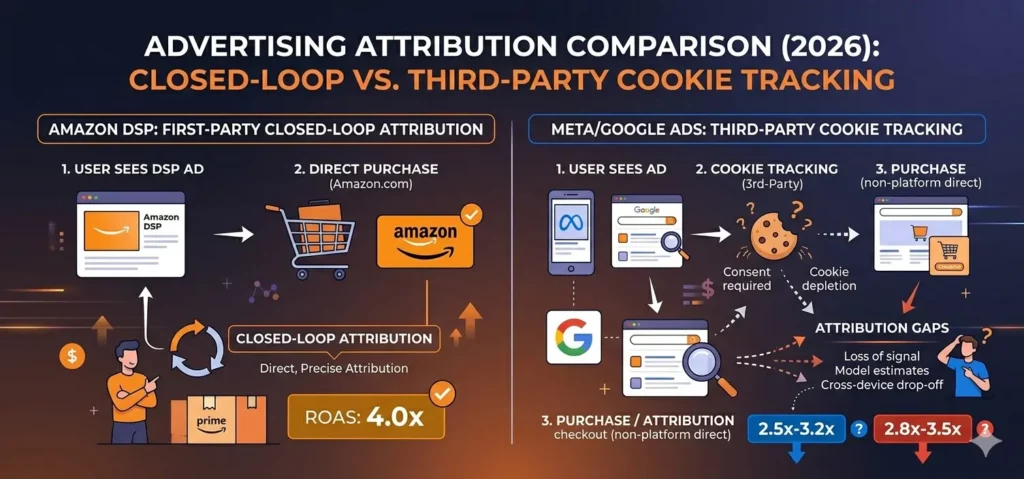
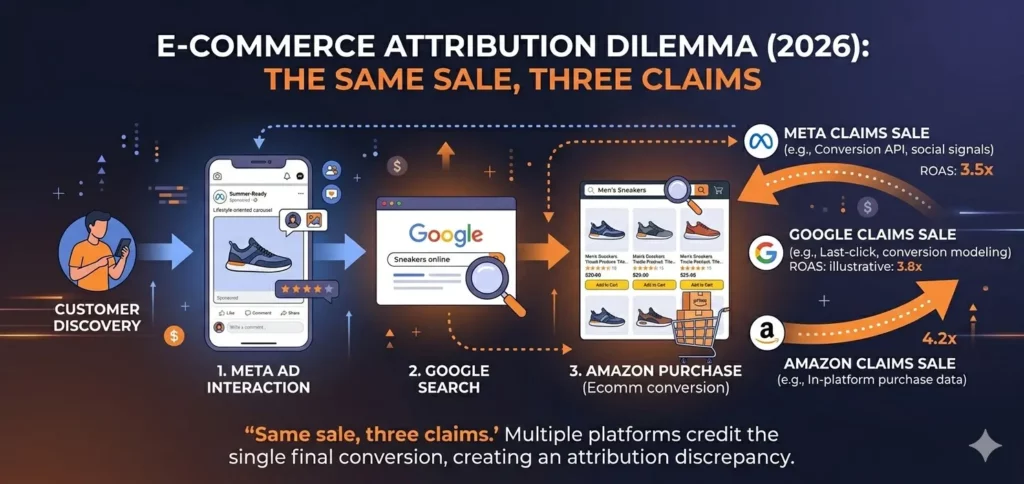
Important caveat on all these numbers: ROAS figures from platforms are self-reported using their own attribution models. Google’s last-click model gives Google search credit for purchases that were actually influenced earlier by Meta or CTV awareness. Meta’s post-impression attribution gives Meta credit for purchases where the ad was barely noticed. Amazon’s closed-loop attribution is generally more reliable for retail outcomes, but it still has limitations for full-funnel measurement.
This is why blended ROAS — total revenue divided by total ad spend across all channels — is a more honest measure than any single platform’s reported number. A brand that is running Meta + Google + Amazon in an integrated way should be measuring the combined output, not comparing each platform’s self-reported metric in isolation.
The attribution problem in plain terms
Imagine a customer who sees your product in a Meta ad on Monday, searches your brand on Google on Wednesday, and buys on Amazon on Friday. Meta takes credit for a view-through conversion. Google takes last-click credit for the branded search. Amazon attributes the sale to its ad ecosystem. All three platforms claim the same sale. That’s why blended ROAS and incrementality testing matter far more than platform-reported numbers.
Breaking Down Each Platform for Amazon Brands
Amazon Sponsored Ads and DSP: The Home Court Advantage
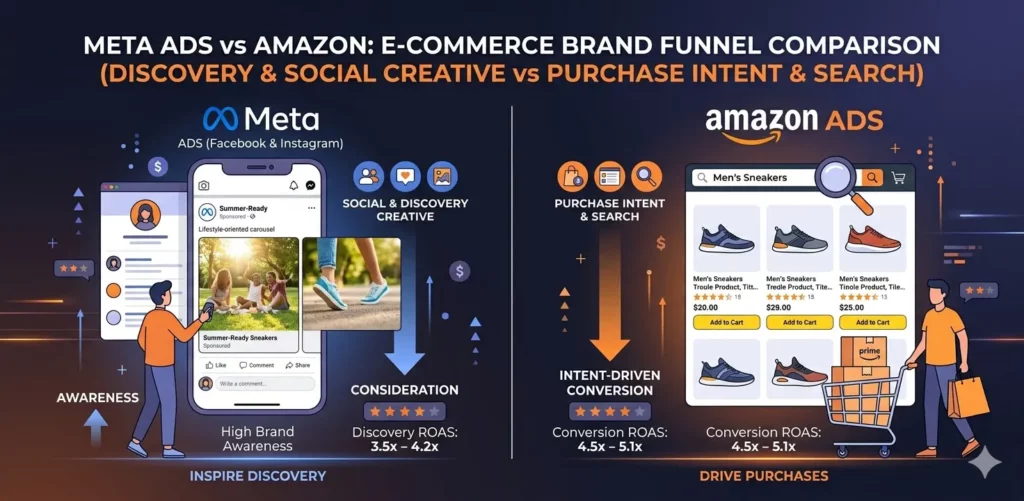
For brands selling on Amazon, Sponsored Products and Sponsored Brands are the foundation. The conversion rate on Amazon search is consistently higher than any other channel because the buyer is already in shopping mode, on the platform where they’re about to transact.
The average conversion rate for Amazon Ads sits around 9.96% — notably higher than display ads or social platforms, where conversion rates typically sit between 1% and 3%.
Amazon DSP extends that same purchase-data advantage to placements off Amazon — display ads, streaming TV, third-party sites — using the same first-party behavioral data. Prospecting DSP campaigns will look less impressive on ROAS than Sponsored Products, but they build the audience pool that retargeting campaigns then convert at high efficiency.
Where Amazon DSP specifically outperforms other programmatic options is closed-loop attribution. When someone sees an Amazon DSP ad and then buys on Amazon, that conversion is measurable within the Amazon ecosystem — no third-party cookies needed. As privacy restrictions continue to limit Meta and Google’s tracking capabilities, Amazon’s first-party closed loop becomes a more and more significant structural advantage.
Google Ads: Capturing Intent, Losing the Retail Battle
Google remains the master of search intent. When someone types ‘best collagen protein powder for women’ into Google, they’re in research mode and Google’s ads can capture that intent efficiently. For categories with high search volume and lower Amazon presence, Google is often the right primary channel.
But for ecommerce brands competing on Amazon, Google has a structural problem. Amazon itself is Google’s biggest advertiser — Amazon’s own product listings dominate Google Shopping results, and when a shopper clicks a Google Shopping ad and lands on Amazon, they’re in Amazon’s ecosystem, not yours. The clicks cost you money, Amazon gets the conversion, and attribution gets messy.
Google Search still works well for branded keywords — someone searching your brand name converts at very high rates because they already know you. But non-branded search in competitive retail categories is increasingly expensive and increasingly won by Amazon’s own listings.
Google Shopping ads drive 66% of all Google retail clicks. The average ecommerce CPC on Google Search sits around $1.16 — a number that has risen steadily as competition from Amazon listings intensifies.
Source: Marketing LTB — Ecommerce Advertising Statistics 2025
Google still belongs in most Amazon brands’ media mix — particularly for branded search, YouTube awareness, and Performance Max campaigns that can capture demand across Google’s full inventory. But it should be treated as a complementary channel that captures intent, not the primary platform for driving Amazon sales.
Meta Ads: Demand Creation at Scale, Attribution at Risk
Meta is the best platform in the world for making people want something they didn’t know they wanted. The creative canvas, the audience targeting based on interest and social signals, and the sheer scale of Facebook and Instagram reach mean that Meta is often the most efficient channel for top-of-funnel brand discovery.
For Amazon brands specifically, Meta works as a demand creation engine that feeds other channels. A Meta ad introduces your brand, a potential customer searches your name on Google or Amazon, and they convert. Meta rarely gets direct credit for that sale under last-click attribution, which is why Meta ROAS often looks underwhelming to brands that measure it in isolation.
Meta’s biggest challenge in 2026 is tracking. Following Apple’s iOS privacy changes, 49% of Meta advertisers report iOS tracking still hurting performance in their campaigns. Meta has responded with aggregated event measurement and modeled conversions, but the data accuracy gap compared to Amazon’s closed-loop system is real.
Meta is the right choice when your product benefits from visual storytelling and social proof — fashion, beauty, lifestyle, home goods, food. If your product sells itself with images or video, Meta’s creative environment and the social trust signals (likes, comments, shares) work in your favor.
Head to Head: Amazon DSP vs Meta vs Google
| Dimension | Amazon DSP | Meta Ads | Google Ads |
| Primary strength | Purchase intent data, closed-loop attribution | Scale of reach, visual discovery, social proof | Search intent capture, branded keyword efficiency |
| Data quality | First-party purchase data (strongest for retail) | Interest + social graph (weakened by iOS privacy changes) | Search intent signals (strong but limited to search moments) |
| Average ROAS (ecommerce) | Prospecting: 1-3x direct. Retargeting: 3-8x+ | Blended: 2.5-4.0x. Retargeting: 7.1x | Shopping: 4-7.5x. Branded search: 8x-20x+ |
| Attribution reliability | High for Amazon sales (closed-loop, no cookies needed) | Moderate — iOS changes reduced signal accuracy | High for search-attributed sales. Branded search inflated by other channels. |
| Creative requirements | Display, video, dynamic ecommerce ads | Images, video, carousels — creative drives performance | Text (search). Product catalog images (Shopping). Video (YouTube). |
| Minimum viable budget | $5K-10K/month for DSP to generate clean data | No hard minimum — $3K+/month for meaningful data | No minimum — competitive CPCs require $2K+/month |
| Best for Amazon brands | Full-funnel: awareness to retargeting. Off-Amazon reach. | Brand awareness, top-of-funnel, driving branded search to Amazon | Branded search capture, Google Shopping for non-Amazon products |
| Worst use case | Too small a product/brand for the audience to respond | Bottom-funnel conversion campaigns (iOS tracking gap) | Non-branded retail search in categories where Amazon listings dominate |
Why ROAS Comparisons Between Platforms Are Often Misleading
This deserves its own section because it’s where most multi-channel decisions go wrong.
Each platform uses its own attribution model, with its own lookback windows, its own definition of a conversion, and its own incentive to claim as many sales as possible. Comparing Amazon’s 14-day click/view attribution to Meta’s 7-day click/1-day view attribution to Google’s last-click attribution as if they’re the same metric is like comparing distances measured in miles, kilometers, and nautical miles.
The only clean solutions are:
- Blended ROAS: Total revenue divided by total ad spend across all channels. This doesn’t tell you which channel is working, but it tells you whether your overall advertising is profitable.
- Incrementality testing: Pause a channel or exclude a test group from seeing your ads, then measure whether sales decline. The sales lift that disappears when you pause a channel is its true incremental contribution.
- Amazon Marketing Cloud (AMC): For Amazon-specific attribution, AMC lets you run custom queries showing how DSP, Sponsored Ads, and CTV interact in the path to purchase — seeing the full picture rather than last-click only.
- MER (Marketing Efficiency Ratio): Total revenue divided by total marketing spend — similar to blended ROAS but sometimes includes non-paid channels too. A cleaner top-line view of advertising efficiency.
A practical benchmark: running Meta and Google together typically delivers 20-30% better blended MER than either alone — because Meta builds the awareness that makes Google branded search more efficient. Adding Amazon DSP into that stack extends the reach into commerce-intent placements that neither Meta nor Google covers as well.
Budget Allocation: A Practical Framework for Amazon Brands
Where should an established Amazon brand actually put its ad budget? The answer depends on your revenue size, your brand awareness level, and what stage of growth you’re in. Here’s how we think about it.
| Brand Stage | Monthly Ad Budget | Recommended Split | Rationale |
| Early stage Amazon brand | $5K-$20K/month | 80% Amazon Sponsored Ads, 10% Google branded search, 10% Meta (test) | Prove out Amazon unit economics before adding complexity. Sponsored Products should be fully optimized before DSP. |
| Growing Amazon brand | $20K-$75K/month | 55% Amazon (Sponsored + DSP retargeting), 25% Meta, 20% Google | Amazon DSP retargeting becomes viable. Meta builds awareness that feeds Amazon search. Google captures branded intent. |
| Established multi-channel brand | $75K-$250K/month | 40% Amazon (Sponsored + DSP full-funnel), 30% Meta, 20% Google, 10% CTV/testing | Full DSP funnel including prospecting. Meta drives consistent top-of-funnel. Google captures branded and category search. |
| Scaling brand with DTC presence | $250K+/month | 35% Amazon, 30% Meta, 20% Google, 15% CTV + emerging channels | Multi-channel integration. AMC measurement becomes critical. DSP syncs with Meta retargeting via shared audience insights. |
These splits are starting points, not rules. The right allocation depends heavily on your category, product type, and where your customer acquisition data shows the highest LTV. A CPG brand with repeat purchases and high Subscribe and Save rates should allocate differently than a premium home goods brand with a long consideration cycle.
A simple test to guide allocation
Before splitting budget across channels, run 4 weeks of spending with Amazon Sponsored Ads only. Establish your baseline ROAS and conversion rate. Then add one channel at a time and measure whether your blended ROAS improves. If it doesn’t, either the channel targeting needs work or the channel genuinely isn’t the right fit for your category at this stage.
Which Platform Wins for Each Specific Goal
| Goal | Best Platform | Second Choice | Avoid (for this goal) |
| Drive Amazon sales from existing category search demand | Amazon Sponsored Products | Google Shopping | Meta (too far from purchase) |
| Build brand awareness among new audiences | Meta Ads (video/image) | Amazon DSP Brand+ or CTV | Google non-branded search (expensive, limited reach) |
| Retarget Amazon product page visitors | Amazon DSP (ASIN retargeting) | Sponsored Display (simpler, Amazon-only) | Meta (can retarget but no Amazon intent data) |
| Capture branded search (people searching your brand name) | Google Ads branded search | Amazon Sponsored Products (branded keywords) | Meta (wrong intent channel for brand search) |
| Drive repeat purchases from existing customers | Amazon DSP past purchaser retargeting | Meta DPA retargeting to customer list | Google (limited past purchase audience data) |
| Launch a new product with zero sales history | Amazon DSP in-market prospecting + Sponsored Products auto | Meta awareness campaign to drive initial discovery | Google non-branded (no search volume for new product) |
| Reach affluent buyers in premium categories | Amazon DSP (household income targeting) | Meta (income-based interest targeting) | Google Shopping (harder to target by affluence) |
| Measure true incrementality of ad spend | AMC (Amazon Marketing Cloud) | Incrementality tests on Meta via conversion lift | Platform-reported ROAS on any platform |
The Bigger Picture: Why Retail Media Is Winning Budget From Social and Search
There’s a broader trend worth naming here. Over the past three years, budget has been quietly shifting away from Meta and Google toward retail media networks — and Amazon is the biggest beneficiary of that shift.
The reason is measurement. Brands are frustrated with the attribution gaps in Meta (post-iOS) and with the difficulty of connecting Google spend to actual product sales. Amazon’s closed-loop system — where you can see directly how ad impressions lead to product purchases — gives CFOs and CMOs the accountability they’ve been demanding for years.
More than 80% of digital advertisers have already allocated budget for retail media, and three-quarters of U.S. advertisers plan to increase their retail media budgets in 2026. Retail media now represents close to 18% of all U.S. digital ad spend.
This doesn’t mean Meta and Google are going away. They’re still essential for demand creation and search capture respectively. But the era of Meta eating the majority of ecommerce ad budgets is giving way to a more balanced, channel-specific approach where each platform earns budget based on what it actually contributes — not just what its own analytics claims.
Frequently Asked Questions
Amazon Sponsored Products consistently shows the highest direct ROAS for Amazon-selling brands, because the shopper is already on the platform and in buying mode. Amazon DSP retargeting comes close for warm audiences. But direct ROAS comparison across platforms is misleading because each uses different attribution models — blended ROAS across all channels is a better measure of overall efficiency.
Yes, with realistic expectations. Meta awareness campaigns can drive people to search your brand on Amazon — a signal that shows up as branded search lift in your Amazon analytics. The conversion loop from Meta impression to Amazon purchase is harder to track directly, but AMC can help you see the correlation. Start with a test budget and measure whether branded search volume on Amazon increases after running Meta campaigns.
For brands selling products on Amazon, yes — Amazon DSP’s first-party purchase data is significantly more valuable for product retargeting and prospecting than Google Display’s third-party audience signals. Google Display is broader but less commerce-specific. Amazon DSP is narrower but reaches people who have demonstrated actual purchase intent in your category.
Amazon Marketing Cloud (AMC) is the best tool for understanding how different ad types contribute to Amazon purchases. For cross-platform attribution (Meta influencing Amazon sales), you need either incrementality testing (pausing Meta campaigns and measuring the impact on Amazon branded search and sales) or a third-party attribution tool that ingests data from all channels.
Amazon DSP prospecting campaigns targeting cold audiences (in-market, lifestyle, lookalike) will often show direct ROAS of 1x to 2x — which looks poor compared to Sponsored Products. This is expected. Prospecting DSP builds the audience that retargeting campaigns then convert at 4x to 8x. Judge prospecting DSP by new-to-brand customer acquisition cost and branded search lift, not by direct ROAS alone.
No — Amazon DSP places ads on Amazon-owned properties and third-party publisher networks (display, CTV, apps), but does not place ads inside Meta or Google platforms. If you want to reach audiences on Facebook, Instagram, or Google search, you need to buy those platforms directly. Amazon DSP and Meta/Google are complementary channels, not substitutes for each other.
The Bottom Line
There isn’t a single answer to ‘which channel is better.’ The honest answer is that Amazon DSP, Meta, and Google each do something different, and the brands that grow fastest in 2026 are the ones that use all three in a coordinated way — Meta to build demand, Google to capture branded intent, and Amazon to convert category shoppers and past purchasers at every funnel stage.
The biggest mistake I see is brands chasing the highest reported ROAS on any single platform without looking at the blended picture. A Meta campaign that looks inefficient on its own dashboard might be the thing driving the branded search volume that makes your Google and Amazon campaigns perform so well. You can’t see that without measuring across channels together.
If you’re an established Amazon brand and you haven’t yet built a cross-channel measurement framework, that’s the first project worth investing in — not because it’s glamorous, but because every media allocation decision you make after that will be better informed.
📊 Want Help Building a Cross-Channel Ad Strategy for Your Amazon Brand?
At Eva, we help established Amazon brands build integrated advertising strategies across Amazon DSP, Meta, and Google — with AMC measurement to show how it all works together. Get in touch for a free channel audit.