
Table of Contents
- The Number That Changes Everything
- Attribution vs Incrementality: The Critical Difference
- Introducing iROAS: The Metric That Replaces Bare ROAS
- The Cannibalization Problem: Where Most Amazon Brands Lose Budget
- How Amazon Marketing Cloud Measures Incrementality
- Amazon’s Long Term Sales (LTS) Metric: Built-In Incrementality Proxy
- Branded Search Incrementality: A Specific Approach
- Incrementality Methods on Amazon: Choosing the Right Approach
- What Does Good iROAS Actually Look Like?
- Turning Incrementality Data Into Budget Decisions
- Building an Ongoing Incrementality Program
- Frequently Asked Questions
- Final Thoughts
The Number That Changes Everything
Here’s a scenario I encounter regularly with Amazon brands that are scaling ad spend. They’re running Sponsored Products on their brand keywords, generating strong ROAS — say 8x or 10x — and the dashboard looks healthy. Everything seems to be working.
Then we run an incrementality test. We withhold ads from a small group of their customers for two weeks and measure what happens. Sales in that holdout group drop slightly, but not nearly as much as the ROAS number suggested they would. The people in that group who didn’t see the ads still bought, just through organic search instead of clicking the sponsored ad.
The ‘8x ROAS’ campaign was actually driving very little incremental revenue. Most of those buyers would have found the product organically anyway. The ad was taking credit for sales it hadn’t caused.
This is the incrementality problem, and it affects most Amazon advertising agency accounts to some degree. Sponsored keywords on branded terms, retargeting audiences who were already planning to buy, DSP campaigns reaching existing loyal customers — all of these can produce strong attributed ROAS numbers while delivering very little genuine incremental growth. Amazon Marketing Cloud gives you the tools to find and fix this, and this article shows you exactly how.
71% of advertisers rank incrementality as their most important retail media KPI. Yet 33% of CPG brand marketers and agency professionals measure it at only a basic level — leaving significant budget misallocation undetected.
Attribution vs Incrementality: The Critical Difference
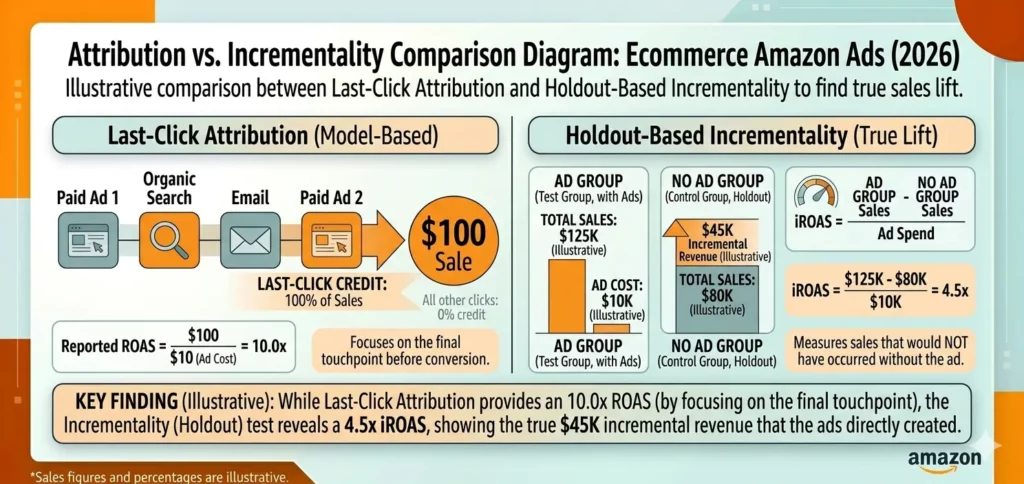
Most brands running Amazon ads are measuring attribution, not incrementality. They sound similar but they answer completely different questions.
| Attribution | Incrementality | |
| Question it answers | Which ad touchpoints were present before a sale? | Did the ad cause the sale to happen, or would it have happened anyway? |
| Method | Assigns credit across touchpoints using a model (last-click, linear, etc.) | Compares a test group (saw the ad) against a control group (did not) |
| What it measures | Correlation between ad exposure and purchase | Causation — the true lift created by the ad |
| Main limitation | Includes sales that would have happened organically | Requires withholding ads from a control group (short-term revenue trade-off) |
| What a high number means | Lots of buyers were exposed to this ad type | This ad genuinely drove purchases that wouldn’t have occurred otherwise |
| Best tool for Amazon | Amazon Marketing Cloud (multi-touch attribution) | AMC holdout studies, iROAS testing, geo-based experiments |
The simplest way to put it: attribution tells you which ads were in the room when a sale happened. Incrementality tells you which ads actually caused the sale.
Both are useful. Attribution helps you understand the customer journey and optimize budget allocation across touchpoints. Incrementality tells you whether the whole system is generating genuine growth or just taking credit for organic demand that already existed.
Introducing iROAS: The Metric That Replaces Bare ROAS
Incremental ROAS (iROAS) is the incrementality-adjusted version of ROAS. Instead of measuring all revenue attributed to your ads, it measures only the revenue that genuinely would not have happened without the ad.
The iROAS formula
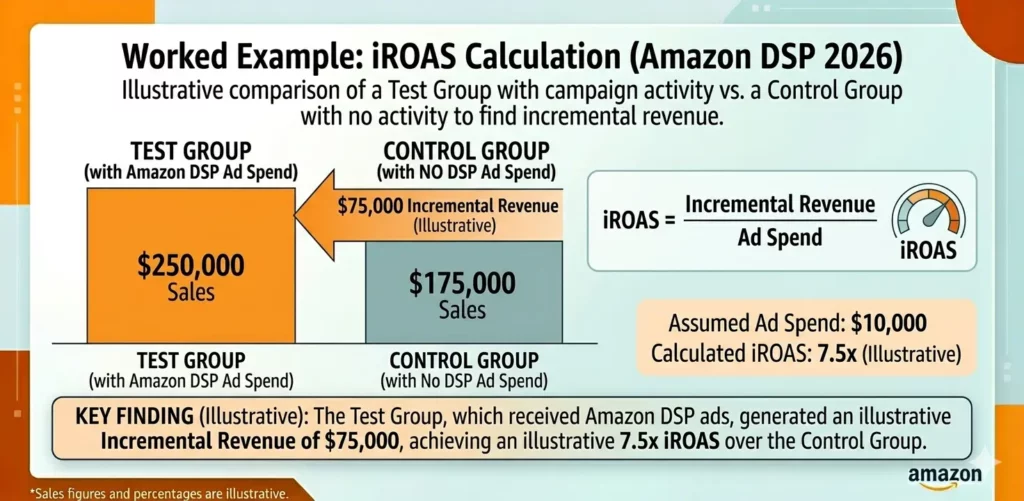
iROAS = Incremental Revenue / Ad Spend
Incremental Revenue = Test Group Revenue minus Control Group RevenueWhere the Control Group is an audience that did not see the ad.
A worked example makes this concrete. A home goods brand ran an Amazon DSP campaign to drive awareness for a new product line and used AMC to set up a holdout group:
- Test Group (saw the ads): Generated $250,000 in sales during the campaign period
- Control Group (did not see the ads): Generated $175,000 in sales organically during the same period
- Incremental Revenue: $250,000 minus $175,000 = $75,000
- Incremental Lift: ($75,000 / $175,000) x 100 = 42.8% lift
- If ad spend was $30,000, iROAS = $75,000 / $30,000 = 2.5x
The campaign’s standard ROAS might have shown $250,000 in attributed sales divided by $30,000 in spend, giving an 8.3x ROAS. The true incremental ROAS was 2.5x — a very different picture. Both numbers are accurate within their own frame. The iROAS number is more truthful about what the ad actually achieved.
The Cannibalization Problem: Where Most Amazon Brands Lose Budget
Ad cannibalization happens when your ads generate sales that would have happened organically anyway — you’re paying for credit rather than for growth. On Amazon, this shows up in predictable patterns, and knowing where to look for it saves significant budget.
Where cannibalization is most common on Amazon
1. Branded keyword Sponsored Products
When a shopper types your exact brand name into Amazon search, they’re already looking for you. They would find your organic listing even without a paid ad. Bidding on your own branded keywords and paying CPC for those clicks often means you’re buying credit for sales that your organic ranking would have captured for free.
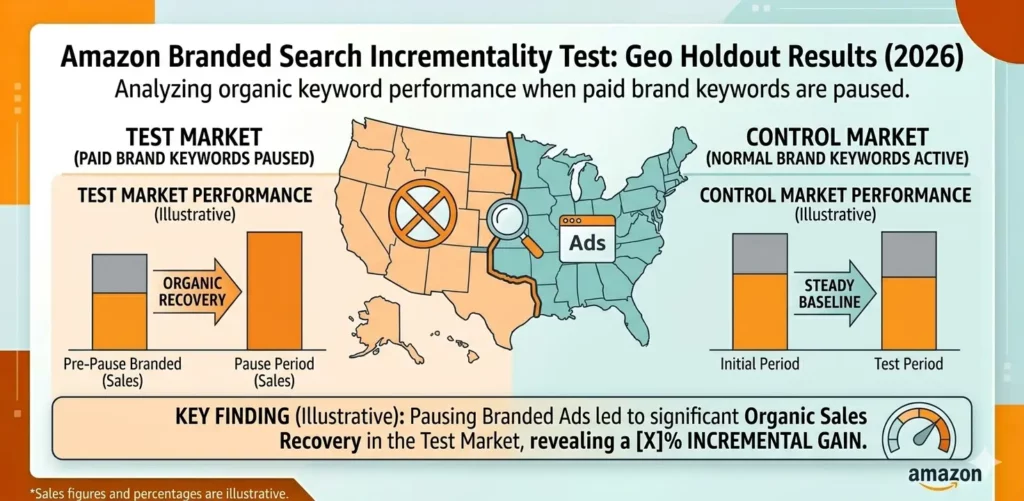
A well-documented geo-holdout test approach involves pausing branded search in a geographic test market for 2-3 weeks and measuring what happens. In many cases, 80-90% of traffic and sales that would have been attributed to branded ads return through organic channels when the paid ad is removed — revealing that most of the branded search spend was buying credit, not driving incremental growth.
2. Retargeting over-saturated audiences
Retargeting audiences — people who already visited your product page — have high intent. They often convert at high rates. But if those people were planning to buy anyway and you retarget them 12 times in a week, you’re spending CPM budget to reach an audience that didn’t need convincing. The high ROAS looks great. The incremental contribution is minimal.
3. DSP campaigns reaching existing repeat customers
Past purchasers who regularly replenish your consumable product may buy again regardless of whether they see a DSP ad. If your campaign audience is heavily weighted toward loyal existing customers, your attributed ROAS benefits from their predictable purchase behavior without your ad actually influencing it.
4. Retargeting in overlapping campaigns
When Sponsored Products, Sponsored Display, and DSP retargeting campaigns all target the same users simultaneously without exclusion logic, those users see dozens of your ads per week. Many of them were already planning to buy. Every campaign attributes the sale to itself. The incremental contribution of any individual campaign is much lower than it appears.
The cannibalization diagnostic test
Pull your branded keyword search terms from your Sponsored Products campaigns and check what percentage of total sales they represent. If branded terms account for 40%+ of your Sponsored Products revenue, run a small geo holdout test on those terms before scaling. The results often show you can reallocate significant budget from branded search toward genuinely incremental non-branded or DSP prospecting campaigns.
How Amazon Marketing Cloud Measures Incrementality
AMC gives you two approaches to measuring incrementality, and they serve different purposes. Understanding which to use when makes the analysis much more actionable.
Method 1: Holdout Studies in AMC
A holdout study is the gold standard for incrementality measurement. In AMC, you create a control group of shoppers who are eligible to see your ads but are intentionally suppressed from receiving them. After the study period, you compare the purchasing behavior of the exposed group versus the control group.
What makes AMC’s holdout studies particularly valuable is the precision of the control group definition. You can specify exactly which audiences to hold out — for example, ‘shoppers who match my DSP audience targeting criteria but will not receive DSP impressions during this period’ — giving you a genuinely comparable test and control population.
The output is a clear incremental lift percentage and iROAS calculation based on real Amazon purchase data, not modeled estimates.
Setting up a holdout study in AMC: practical steps
- Define your test audience. Identify the campaign or audience type you want to test. Be specific — for example, ‘users in our DSP in-market prospecting audience for the Beauty category.’
- Create the holdout group. In AMC, create a suppression audience that includes a randomly selected 15-20% of your target audience. These users match all your targeting criteria but will not receive ads during the test period.
- Set the test duration. Run the test for at least 3-4 weeks to generate statistically significant data. Shorter periods may be affected by random variation or weekly sales cycles.
- Maintain everything else constant. Don’t change bids, budgets, or targeting during the test period for the campaigns being measured. Any structural change resets the baseline.
- Query the results in AMC. After the test period, run an AMC query comparing purchase rates, revenue, and new-to-brand rates between your exposed group and the holdout group.
- Calculate iROAS. Incremental Revenue = (Exposed Group Revenue) minus (Control Group Revenue scaled to exposed group size). Divide by ad spend on the exposed audience to get iROAS.
- Make budget decisions based on the output. An iROAS below 1.0 means you’re spending money on sales that would have happened anyway. Anything above 2.0 generally indicates strong incremental performance worth scaling.
AMC’s Customer Path Reporting has expanded significantly — it now supports a lookback window of up to 5 years, allowing brands to analyze long-term purchase cycles, replenishment patterns, and repeat customer behavior in ways that weren’t possible before. This extended horizon matters especially for incrementality in consumable categories where purchase cycles span months.
Method 2: Path-to-Purchase Multi-Touch Analysis
While a holdout study is the most rigorous incrementality test, AMC’s path-to-purchase analysis provides ongoing incremental insight without requiring the revenue trade-off of withholding ads from a control group.
A path-to-purchase query shows you the sequence of ad touchpoints that appeared before every conversion in your account. By examining which touchpoints appear early vs late in customer journeys — and which ones appear in journeys that resulted in genuine new-to-brand purchases vs repeat purchases — you can identify which campaigns are driving incremental acquisition versus capturing existing demand.
What to look for in path-to-purchase data
- Campaigns that appear as ‘first touch’ frequently: These are your true demand-creation campaigns. They introduced the shopper to your brand before they were in the market. These tend to be incrementally valuable even if their direct ROAS looks weak.
- Campaigns that appear only as ‘last touch’: These often capture demand that was already there — particularly branded search campaigns. They may be partially cannibalizing organic.
- New-to-brand rate by touchpoint sequence: Paths that contain a DSP awareness ad first tend to have higher NTB rates than paths that start and end with branded search. This is a proxy indicator of incrementality.
- Campaigns that appear in high-value customer journeys: A campaign that’s present in journeys that ended with a Subscribe and Save signup is more incrementally valuable than one that only appears in single-purchase journeys, even if the ROAS looks similar.
Amazon’s Long Term Sales (LTS) Metric: Built-In Incrementality Proxy
In October 2024, Amazon introduced the Long Term Sales (LTS) metric in the Ads Console — a built-in measurement that estimates the incremental sales value a brand can expect over the next 12 months, based on how effectively current ads are moving new-to-brand shoppers further down the purchase funnel.
LTS takes into account the downstream value of non-purchase engagements — detail page views, branded searches, add-to-carts — treating them as indicators of future purchase intent rather than failed conversions. A shopper who viewed your product page three times without buying is still moving toward purchase. LTS quantifies the likely value of that progression.
Amazon’s Long Term Sales (LTS) metric estimates the 12-month incremental revenue expected from current advertising campaigns based on how effectively they move new-to-brand shoppers through the purchase funnel — giving advertisers their first real-time incrementality proxy directly in the Ads Console.
Source: Amazon Ads — Understand the Value of New-to-Brand Shoppers Beyond Immediate Sales, October 2024
LTS ROAS vs Standard ROAS: LTS ROAS measures the 12-month estimated incremental revenue from an ad against ad spend. A campaign with a low standard ROAS but a high LTS ROAS is one that’s acquiring new customers who will buy again — exactly the kind of incremental growth that matters for brand building. Viewing LTS ROAS alongside standard ROAS gives you a more complete picture of which campaigns are truly growing your business.
Branded Search Incrementality: A Specific Approach
Branded search cannibalization is so common and so specific that it deserves its own testing framework. Here’s how to measure it precisely for Amazon Sponsored Products.
The geo-holdout approach for branded search
- Select two comparable geographic markets. Choose two regions that are similar in population size, purchasing behavior, and historical sales for your brand — for example, two mid-sized U.S. metropolitan areas with similar Amazon purchasing patterns.
- Run branded search in the control market, pause it in the test market. For 2-3 weeks, maintain all other advertising (DSP, non-branded search, Sponsored Brands) but remove branded keyword Sponsored Products in the test geography.
- Monitor organic search volume and sales in both markets. Use Brand Analytics to track branded search volume by geography. Check whether organic sales fill the gap left by removing paid branded ads.
- Calculate the organic recovery rate. If you remove $20,000 in branded search spend and organic sales in that market decline by only $3,000, your organic recovery rate is 85%. The incremental value of branded search in that market was only 15% of what was being attributed.
- Make a budget decision based on the data. If recovery rate is above 70-80%, reallocate a significant portion of branded search budget to non-branded or DSP prospecting campaigns that are more genuinely incremental.
This approach doesn’t mean eliminating all branded search spend. Branded keywords provide some value as defensive coverage — preventing competitors from appearing in that slot when a customer searches your brand. But that defensive value is worth much less than what most brands currently spend on it, and AMC incrementality testing helps you find the right level.
When to keep branded search
Branded search is more incrementally valuable in two situations: when your brand is in a highly competitive category where a competitor frequently conquests your branded terms, and when your organic ranking for branded terms is not reliably in position 1-2. In those cases, the paid ad provides genuine coverage that organic can’t guarantee. Test, don’t assume.
Incrementality Methods on Amazon: Choosing the Right Approach
There are several ways to measure incrementality on Amazon, ranging from simple proxies to rigorous holdout studies. The right choice depends on your budget, data access, and how much precision you need for the decision at hand.
| Method | How It Works | Cost | Precision | Best For |
| AMC Holdout Study | Suppress ads from a 15-20% control group. Compare purchase behavior after 3-4 weeks. | Free (included in AMC access) | High — actual purchase data from real test/control split | DSP campaigns, major budget decisions, ongoing measurement |
| Geo-Based Holdout | Pause campaigns in one geographic market while maintaining in another. Compare sales trends. | Free — uses existing campaign infrastructure | Medium-High — depends on market similarity | Branded search, CTV campaigns, TV-like inventory |
| Amazon Long Term Sales (LTS) Metric | Built-in Ads Console metric estimating 12-month incremental value from NTB engagement signals. | Free — available in standard reporting | Medium — modeled estimate, not experiment-based | Ongoing monitoring without a formal test setup |
| New-to-Brand Rate Proxy | Track NTB rate by campaign. Higher NTB = more likely incremental. Lower NTB = more likely cannibalization. | Free — available in AMC and some Ads Console reporting | Low-Medium — indicator, not direct measurement | Quick diagnostic, early signal before running a full test |
| Marketing Mix Modeling (MMM) | Statistical model using historical data to attribute sales across all channels. | $50,000 to $500,000+ with external partners | Medium — depends on data quality and model assumptions | Enterprise-level cross-channel media mix decisions |
| Holdout with iROAS Console (Pacvue etc.) | Third-party platform that automates holdout test setup, measurement, and iROAS calculation. | Platform fee varies — typically part of managed service | High — structured test methodology with automated analysis | Brands with existing ad tech relationships wanting streamlined testing |
For most established Amazon brands, the most practical starting point is a combination of: AMC path-to-purchase analysis to identify which campaigns look potentially non-incremental, followed by a focused AMC holdout study or geo test on those specific campaigns to confirm. You don’t need to test every campaign simultaneously — start where the budget is largest and the cannibalization risk is highest.
What Does Good iROAS Actually Look Like?
One of the most common questions after running an incrementality test is ‘is this good?’ The answer depends on what you’re testing, but here are practical benchmarks.
| iROAS Range | What It Means | Recommended Action |
| Below 1.0 (under 100%) | Spending more on ads than the incremental revenue they generate. High cannibalization likely. | Significantly reduce or pause this campaign. Reallocate budget to higher-incrementality channels. |
| 1.0 to 2.0 (100-200%) | Marginal incrementality. Some genuine lift, but likely significant cannibalization. | Reduce budget and tighten targeting. Add exclusions to remove already-committed audiences. |
| 2.0 to 4.0 (200-400%) | Solid incremental performance. Campaign is creating real demand. | Maintain or scale carefully. Continue testing with larger budgets. |
| 4.0 to 8.0 (400-800%) | Strong incrementality. Campaign is efficiently creating sales that wouldn’t exist otherwise. | Scale this campaign type. Look for audiences or formats with similar profiles. |
| Above 8.0 (800%+) | Exceptional incrementality. Likely an awareness or prospecting campaign reaching genuinely new audiences. | Prioritize heavily. This is where your growth is coming from. |
For context: a beauty brand geo holdout study comparing Amazon, Ulta, and Sephora showed Amazon delivering 2.8x iROAS — categorized as strong incremental performance — which led the brand to shift 30% of Sephora’s budget to Amazon, resulting in 22% more incremental sales overall. The iROAS test directly informed a meaningful budget reallocation decision.
Turning Incrementality Data Into Budget Decisions
Incrementality measurement is only valuable if it changes what you do with your budget. Here’s how to translate the findings into concrete actions.
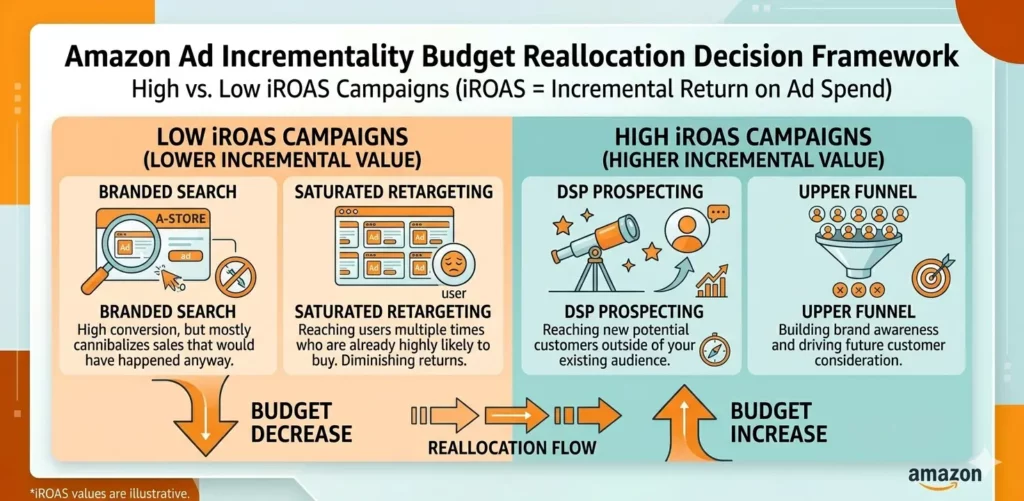
Campaigns that typically show low incrementality — and what to do
- Heavy branded search Sponsored Products: Reduce branded search budget. Test a 30-40% reduction. If branded sales stay strong (likely through organic), permanently reallocate that budget to non-branded or DSP.
- Retargeting audiences with very high frequency: Add frequency caps, shorten lookback windows on the lowest-intent retargeting segments, and reduce bids on audiences showing very high organic purchase rates in the control group.
- DSP campaigns targeting existing loyal customers: Add past purchaser exclusions to your prospecting campaigns. Move loyal customer outreach to a separate lower-CPM program with replenishment messaging.
Campaigns that typically show high incrementality — and what to do
- DSP in-market prospecting (non-branded category audiences): Scale these. They’re finding people who weren’t already planning to buy from you, which is genuine incremental growth.
- Brand+ awareness campaigns with CTV: High first-touch incrementality in path-to-purchase analysis. Scale with appropriate creative quality.
- Competitor ASIN targeting in DSP: Reaching people who were about to buy from a competitor is highly incremental. Expand these audiences with careful creative that clearly communicates your differentiation.
- Lookalike audiences based on high-LTV customers: If the lookalike test shows meaningful iROAS, this is the most scalable incremental acquisition channel available in DSP.
? The Budget Reallocation That Incrementality Enables
Brands that run incrementality testing through AMC consistently find 10-25% of their ad budget going toward campaigns with sub-1.0 iROAS — paying for credit rather than growth. Reallocating that budget toward genuinely incremental campaigns often produces more total sales from the same spend. If you want help running an AMC incrementality analysis for your account, that’s exactly what we do at Eva AI.
Building an Ongoing Incrementality Program
A single holdout test is useful. A regular cadence of incrementality testing is what separates brands that continually improve their media efficiency from those that drift toward cannibalization over time.
| Cadence | What to Test | Decision It Informs |
| Quarterly | Run AMC holdout study on your largest DSP audience type (in-market prospecting or retargeting) | Whether to scale, maintain, or reduce that DSP segment |
| Before each major budget shift | Run geo holdout on branded search whenever considering a 20%+ change in branded search budget | Whether the change will actually affect total sales or just shift organic to paid |
| Post-campaign for new formats | Run path-to-purchase analysis 60 days after launching a new ad type (CTV, audio, new DSP segment) | Whether the new format is driving incremental conversions or just overlapping with existing campaigns |
| Annual | Full iROAS review across all major campaign types using AMC multi-touch data combined with geo experiments | Annual media plan and budget allocation for the coming year |
The goal over time is to build an internal benchmark of iROAS for each campaign type, so that when you launch a new format or consider scaling an existing one, you’re comparing against data rather than intuition.
Frequently Asked Questions
Standard ROAS measures all revenue attributed to your ads (regardless of whether those sales would have happened anyway). iROAS measures only the revenue that genuinely would not have occurred without the ad — by comparing a test group that saw the ad against a control group that didn’t. iROAS is always equal to or lower than standard ROAS. When they’re close, your ads are genuinely incremental. When they diverge significantly, you have a cannibalization problem.
A minimum of 3 weeks, and ideally 4-6 weeks. Shorter periods may not generate enough statistical significance, and can be skewed by natural weekly sales cycles. For products with longer purchase cycles (high-consideration items, seasonal products), 6-8 weeks gives you more reliable data.
A small portion — yes. The control group doesn’t see your ads during the test period, so some of them who would have clicked an ad and converted may not during the test. This is the short-term revenue trade-off of incrementality measurement. For a 15-20% holdout on a well-run campaign, the data value almost always outweighs the brief revenue impact. Think of it like running a controlled experiment before making a much larger budget decision.
The larger the better for statistical significance, but as a practical minimum, aim for a holdout group of at least 5,000-10,000 eligible users. Smaller holdout groups can produce results, but the confidence interval will be wide enough to make the finding hard to act on.
Both, through different methods. AMC holdout studies work best for DSP campaigns, where you can directly suppress the holdout group from receiving impressions. For Sponsored Products branded search, geo-based holdout tests (pausing campaigns in one market while running in another) are the most practical approach, since suppressing individual users from search auctions is technically harder.
LTS is Amazon’s built-in proxy for incrementality — it estimates the 12-month forward revenue expected from campaigns based on how effectively they’re creating new customer engagement (detail page views, branded searches, first-time purchases). It’s not an experiment-based measure, so it’s less rigorous than a holdout study. But it’s available in the standard Ads Console without any special setup, making it a useful ongoing indicator of which campaigns are building genuine new demand versus capturing existing intent.
No. Start with your largest campaigns and the ones most likely to have cannibalization risk — branded search, heavy retargeting, and any campaign where you have a strong organic presence. The analysis is most valuable where the budget is biggest and the question of organic substitution is most likely. From there, build a testing calendar rather than trying to measure everything at once.
Final Thoughts
Incrementality measurement is one of those topics that sounds technical until you understand what’s actually at stake. If 25% of your ad spend is going toward campaigns that are taking credit for organic sales rather than creating new ones, that’s a significant slice of budget that could be moved to campaigns that genuinely grow your business.
AMC makes that analysis possible in a way that was genuinely unavailable to most brands just two years ago. Holdout studies, path-to-purchase analysis, LTS metrics, and the iROAS framework together give you a clear picture of where your ads are earning their spend and where they’re not.
The brands that build this discipline into their measurement practice — running regular incrementality tests alongside standard attribution, reviewing iROAS alongside ROAS, and making budget allocation decisions based on causal data rather than correlation — consistently outperform peers who optimize purely for attributed efficiency.
It’s not the easiest thing to get started. But it’s one of the highest-ROI investments a well-established Amazon brand can make in their measurement infrastructure.
? Want Help Setting Up Incrementality Testing for Your Amazon Account?
At Eva AI, we help established Amazon brands design and run AMC holdout studies, interpret iROAS results, and translate the findings into concrete budget reallocation decisions. Get in touch for a free incrementality assessment.
For the broader analytics layer behind incrementality testing, see Eva’s Amazon Marketing Cloud guide.
AMC is one of the practical tools Amazon advertisers use when they need better evidence for incrementality and audience quality. See the Amazon Marketing Cloud guide.
Performance+ can create scale, but brands still need incrementality discipline. Our Amazon Performance+ guide explains how to evaluate it in a full-funnel plan.