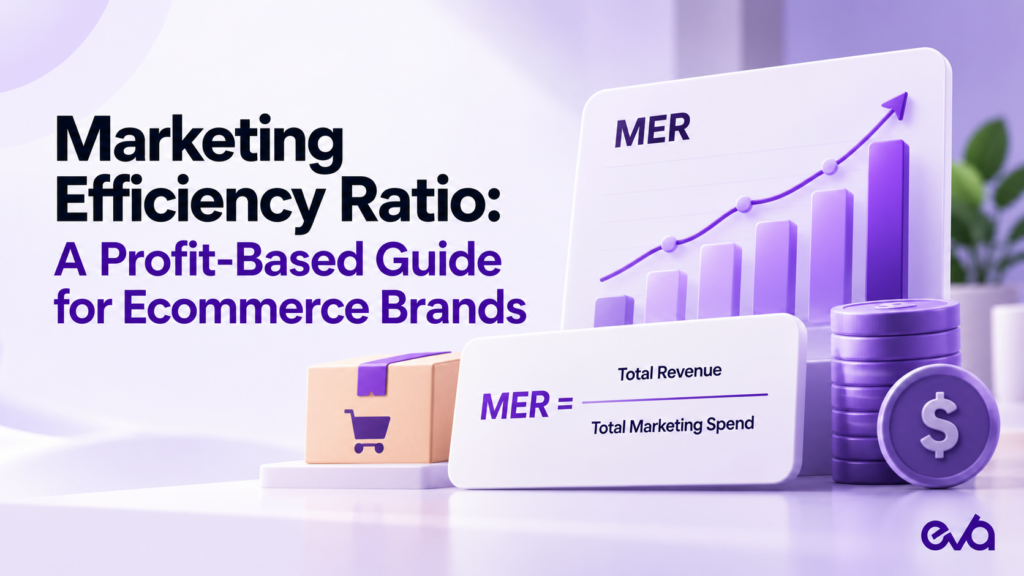
Marketing efficiency ratio (MER) measures revenue per marketing dollar: MER = revenue ÷ marketing spend. A 4.0x MER means $4 in revenue for every $1 spent, not $4 in profit. A useful target depends on contribution margin and the amount the business needs to retain after marketing. MER summarizes business-level efficiency; it does not identify which channel caused a sale.
A Shopify team might report strong campaign returns while the finance team sees less cash available for inventory. An Amazon team might improve advertising efficiency while the wider business loses customers. Both reports can be accurate because they answer different questions.
This guide explains how to calculate MER, set a target from your own economics, and use it in a weekly budget review without confusing revenue efficiency with profitable growth. All numerical examples below are hypothetical teaching examples, not Eva customer results or industry benchmarks.
Table of Contents
- What is marketing efficiency ratio?
- Define the inputs before comparing results
- MER vs ROAS: different questions, different decisions
- What is a good marketing efficiency ratio?
- Calculate your break-even and target MER
- Turn the target into a budget envelope
- Handle Amazon and Shopify without hiding channel economics
- Diagnose changes before changing spend
- Use a weekly review that leads to a decision
- What MER cannot prove
- Frequently asked questions
- Turn your marketing numbers into a clearer growth plan
What is marketing efficiency ratio?
Marketing efficiency ratio, or MER, compares a business's revenue with its marketing spending over the same period. Expressed as a multiple, it shows how many dollars of revenue the business recorded for each dollar included in the marketing budget.
The basic formula is:
MER = revenue ÷ marketing spend
For example, $300,000 in revenue divided by $75,000 in marketing spend produces a ratio of 4.0x. That means four dollars of revenue for every marketing dollar. It does not mean four dollars of profit.
Shopify’s explanation of MER uses total revenue divided by total marketing spend. In practice, teams use different cost boundaries, so every report should state exactly what its denominator contains.
For the operating framework in this article, use net revenue and a documented marketing cost definition. Keep this management reporting view consistent with finance’s reconciliation process rather than treating the formula as a replacement for accounting.
Define the inputs before comparing results
The calculation takes seconds. Agreeing on comparable inputs requires more care. A higher ratio can come from a real business improvement, a narrower cost definition, or a timing mismatch. Only the first represents improved performance.
Choose a revenue boundary
Start with one finance-approved revenue measure. Document how it treats discounts, refunds, cancellations, shipping income, and taxes. For a management view based on net merchandise revenue, exclude collected sales taxes and account for returns consistently. If your business includes shipping income, reflect the associated costs in the contribution calculation.
Use the same currency and reporting timezone across the selected channels. Distinguish order revenue from cash settlements: a marketplace payout reflects payment timing and deductions, so it should not quietly replace sales revenue in the numerator.
Also prevent internal duplication. Moving inventory from a warehouse to a marketplace is not another end-customer sale. Importing the same marketplace order into an order-management system should not create a second revenue record.
Choose a marketing cost boundary
A media-only view includes advertising spend. A fully loaded marketing view can also include agency fees, creative production, creator payments, marketing software, and relevant staff costs. Either can support a decision if it is clearly labeled and applied consistently.
For example, $300,000 in revenue against $60,000 in media spend equals 5.0x. Add $15,000 in other marketing costs and the fully loaded result becomes 4.0x. Nothing about customer behavior changed. The measurement boundary changed.
Maintain both views when useful, but never compare one with the other as if they were the same metric. Assign each cost to one category so affiliate commissions, marketplace fees, and creative invoices are not accidentally counted twice.
Match the period
Use the same completed reporting period for revenue and cost. If a production invoice covers a quarter, apply a documented allocation policy when evaluating monthly performance. Do not change that policy to make an individual month look better.
A weekly view is useful for pacing, while a trailing 28-day view can reduce noise. Neither resolves long purchase cycles or delayed returns automatically. Keep an adjustment log and mark a period provisional when material costs or refunds are still missing.
MER vs ROAS: different questions, different decisions
ROAS normally compares revenue attributed to advertising with advertising spend. MER compares the business revenue inside a defined boundary with the marketing cost inside that boundary.
| Metric | Practical question | Main limitation |
|---|---|---|
| Campaign ROAS | How is this campaign performing under its attribution settings? | Credited sales depend on measurement rules |
| Blended MER | Is total revenue keeping pace with the selected marketing costs? | Does not assign causal credit to channels |
| Customer acquisition cost | What does acquiring a new customer cost under our definition? | Requires a consistent new-customer boundary |
| Contribution after marketing | What remains after variable operating costs and marketing? | Still does not equal cash flow or final net income |
“Blended ROAS” is sometimes used as another name for MER. Before accepting that label, inspect the numerator and denominator. A revenue-to-media-spend ratio and a revenue-to-all-marketing-cost ratio are different calculations.
Do not add the revenue credited by Meta, Google, and Amazon advertising reports to construct total business revenue. Different attribution systems can claim credit for related shopping journeys. Use reconciled order or finance data for the business total and retain platform reports for campaign diagnosis.
For Amazon-specific advertising decisions, use Eva’s Amazon ROAS strategy guide alongside this business-level view. The purpose of this article is to set a cross-channel budget boundary, rather than replace campaign management or Amazon-specific performance analysis.
What is a good marketing efficiency ratio?
There is no universal good MER. A useful target depends on pre-marketing contribution margin and the contribution the business needs to retain after marketing. For example, a hypothetical 40% pre-marketing margin and 15% retained contribution require a 4.0x fully loaded MER.
A good result is one that supports your margin requirements, acquisition strategy, and operating obligations. A universal target such as “every brand should achieve 4x” leaves out too much information to guide a budget.
Consider two hypothetical brands generating the same revenue and spending the same amount on marketing. One retains 50% of revenue after product and variable operating costs. The other retains 25%. Their reported MER can be identical while their ability to fund overhead and growth is very different.
Product mix also matters within one company. A promotion might increase total revenue while shifting sales toward products with lower contribution. The ratio improves, yet the money available after variable costs shrinks.
Use an external benchmark only after checking its revenue definition, spend definition, sample, period, and category. Without that context, it is a conversation starter rather than a budget rule.
Calculate your break-even and target MER
The following framework is an algebraic planning model. It assumes the stated contribution rate holds over the revenue range being considered. It is not a prediction of what additional advertising will generate.
First calculate your pre-marketing contribution margin rate:
m = (net revenue − variable non-marketing costs) ÷ net revenue
Variable non-marketing costs may include product cost, fulfillment, payment processing, marketplace selling fees, and expected return-related costs. Include the costs relevant to the business and avoid placing the same item in both this calculation and the marketing denominator.
If that contribution rate is 40%, the marketing-only break-even ratio is:
Break-even MER = 1 ÷ m = 1 ÷ 0.40 = 2.5x
At 2.5x, marketing consumes the entire pre-marketing contribution. There is nothing left from that contribution to cover fixed overhead, financing, taxes, or profit. Calling this “business break-even” would therefore be misleading.
To preserve a chosen share of revenue after marketing, define that retained contribution share as r:
Target MER = 1 ÷ (m − r)
With a 40% pre-marketing contribution margin and a requirement to retain 15% of revenue after marketing, the target becomes:
1 ÷ (0.40 − 0.15) = 4.0x
| Hypothetical pre-marketing margin | Required contribution after marketing | Implied target MER |
|---|---|---|
| 30% | 10% of revenue | 5.0x |
| 40% | 15% of revenue | 4.0x |
| 50% | 15% of revenue | About 2.86x |
This model requires m to be greater than r. If the required retained share equals or exceeds the contribution available before marketing, a finite positive marketing budget cannot satisfy the requirement under those assumptions.
Finance should translate overhead and profit requirements into a realistic retained share. Recalculate when pricing, freight, fees, discounts, returns, or product mix changes materially.
Turn the target into a budget envelope
Suppose a hypothetical brand expects $300,000 in net revenue, a 40% pre-marketing contribution margin, and a 15% contribution requirement after marketing.
Its total marketing allowance is:
Marketing allowance = revenue × (m − r)
$300,000 × (0.40 − 0.15) = $75,000
If committed creative, agency, and software costs total $15,000, the remaining media allowance is $60,000. Reporting a fully loaded MER while giving media buyers the entire $75,000 would overspend the defined envelope.
Now stress-test the plan. If revenue reaches only $240,000 while all marketing costs remain $75,000, MER falls to 3.2x. At the same margin rate, pre-marketing contribution is $96,000, leaving $21,000 after marketing. That is 8.75% of revenue, below the planned 15%.
This does not automatically mean every campaign should be cut. It means the original budget assumptions no longer hold. Investigate revenue timing, demand, inventory availability, conversion, and spending commitments before deciding what can be changed responsibly.
The envelope also does not prove that spending up to the limit will create the forecast revenue. Revenue forecasts need their own evidence and downside scenarios.
Handle Amazon and Shopify without hiding channel economics
A combined view is useful when leadership allocates a shared budget. It becomes misleading when a healthy channel conceals a weak one.
Build the report in three layers:
- Business total: reconciled revenue, total marketing cost, MER, and contribution after marketing.
- Channel economics: Amazon, Shopify, and other channels, each with its own revenue and variable costs.
- Customer and product context: new-customer acquisition, repeat purchasing, product mix, and stock availability where reliable data exists.
Keep shared marketing costs in a separate line until there is a defensible allocation policy. A creator campaign may support discovery across several storefronts. Assigning all of its cost to one channel can distort that channel’s apparent efficiency.
Do not assume customer identities can be matched across marketplaces and a direct store. Label customer-level comparisons as unavailable when the available data does not support them.
For acquisition economics, Eva’s ecommerce customer acquisition cost guide addresses a separate question: what the brand spends to acquire a new customer. Keep that analysis beside MER so repeat-customer revenue does not conceal an acquisition problem.
Diagnose changes before changing spend
A useful review begins with an explanation of what changed. The same movement in MER can require very different actions.
MER rises while revenue and new customers fall
Check whether the brand reduced prospecting and now relies more heavily on existing customers. Better short-term efficiency may accompany a smaller future customer base. Review customer acquisition, contribution, and the expected purchase cycle before celebrating the higher ratio.
MER falls while contribution dollars rise
The brand may be accepting a lower revenue multiple while generating more money after variable costs and marketing. Confirm that the improvement survives returns and outstanding invoices. Then compare it with the approved growth and cash plan rather than judging the ratio alone.
MER rises during heavy discounting
Compare the margin rate before and after the promotion. A larger order total does not establish better economics if the discount and fulfillment burden absorb the extra revenue. Rebuild the target using the promotional product mix.
MER falls during a stockout
Check whether paid activity continued sending shoppers to unavailable products or weak substitutes. Correct availability and messaging before treating the situation purely as an advertising efficiency problem. Record the dates so the affected period is not used as a normal baseline.
MER changes after reporting updates
Reconcile refunds, agency invoices, attribution settings, exchange rates, and accounting cutoffs. If the change comes from measurement, annotate the report and rebuild comparable periods where practical. Do not interpret a corrected denominator as a sudden change in consumer demand.
Use a weekly review that leads to a decision
Give finance ownership of the revenue and cost definitions, marketing ownership of campaign diagnosis, and operations ownership of inventory and fulfillment constraints. One person should reconcile the final report so disagreements do not become competing spreadsheets.
Start the meeting with a compact scorecard:
| Review field | Why it belongs in the meeting |
|---|---|
| Completed period and data status | Prevents comparisons against partial reporting |
| Net revenue and marketing cost | Makes the ratio auditable |
| Actual and target MER | Shows the size of the efficiency gap |
| Contribution after marketing | Connects the discussion to business economics |
| New-customer and repeat-sales context | Flags dependence on existing demand |
| Inventory and cash constraints | Identifies limits on responsible scaling |
| One proposed action and owner | Turns analysis into accountable work |
Choose an action that matches the diagnosis. Examples include repairing a broken landing page, excluding an unavailable product from a campaign, revising a promotion, or testing a bounded budget increase. Set a review date and a stopping condition before making the change.
Avoid changing several major inputs simultaneously when the goal is to learn. If budget, pricing, creative, and targeting all change at once, the next review will struggle to explain the result.
What MER cannot prove
MER cannot establish how much revenue would have happened without advertising. Organic discovery, existing customers, promotions, distribution changes, and seasonality all influence the numerator.
To investigate causality, use an appropriately designed experiment when feasible. Google’s Conversion Lift documentation describes comparing treatment and control groups to estimate advertising’s incremental effect; availability depends on the account. A simple before-and-after comparison does not provide the same evidence.
MER also does not show cash available for inventory purchases. Supplier payment terms, marketplace settlements, stock commitments, and debt payments can create a cash constraint even when contribution looks healthy. Maintain a separate cash forecast.
Finally, an average ratio does not reveal the return on the next dollar. Test incremental budget changes within an agreed risk boundary rather than assuming the historical average will continue indefinitely.
Frequently asked questions
Is MER the same as blended ROAS?
Sometimes teams use the names interchangeably. Check whether the denominator contains media spend alone or all marketing costs, and whether the numerator uses gross or net revenue. The label is less useful than the documented calculation.
Should marketing spend include agency and creative costs?
Include them in a fully loaded view. A media-only view can still help with campaign pacing, but label it separately. Keep every cost in one place when calculating contribution and setting the budget.
Can a high MER be a warning sign?
Yes. A rising ratio alongside falling revenue, shrinking acquisition, or declining contribution dollars may indicate a business that is spending less without building its next source of demand. Investigate the combination of signals.
How often should the target change?
Review the underlying assumptions regularly and revise the target when economics or business requirements change materially. Avoid moving the target simply because the latest result missed it. Record what changed and why.
Should every channel have the same target?
Not necessarily. Different fees, fulfillment costs, margins, and customer behavior can justify different planning thresholds. Reconcile those channel plans to the total business contribution requirement and disclose how shared costs are handled.