In the fast-paced world of Amazon advertising, success isn’t achieved through guesswork or intuition. It’s built on a foundation of data-driven decision making. Yet with hundreds of potential metrics available through Amazon’s advertising console, many sellers find themselves either overwhelmed by information overload or focusing on the wrong numbers entirely.
The most successful Amazon advertisers understand that consistent metric tracking isn’t just a good practice – it’s absolutely essential for sustainable growth. By monitoring the right metrics at the right frequency, sellers can identify optimization opportunities, catch issues before they impact profitability, and make strategic adjustments that drive continuous improvement.
Leading Amazon advertising management services leverage these metrics as the cornerstone of their optimization strategies, using sophisticated analysis techniques to extract actionable insights that drive performance improvements.
Whether you’re managing campaigns yourself or working with a specialized agency, understanding these key metrics is critical for evaluating performance and making informed decisions.
Table of Contents
- ACoS vs. TACoS: Which Matters More for Your Business?
- What Are the 5 Essential Weekly Metrics for Amazon Advertisers?
- How Do Benchmarks Vary by Product Category?
- What Reporting Tools and Dashboards Should You Use?
- Key Questions to Ask When Reviewing Your Weekly Metrics
- Conclusion: Leveraging Metrics for Long-Term Growth
- Frequently Asked Questions About Amazon Advertising Metrics
- How Eva Elevates Your Amazon Advertising Performance
ACoS vs. TACoS: Which Matters More for Your Business?

Before taking a close look at the essential weekly metrics, it’s important to understand the distinction between two of the most frequently discussed metrics in Amazon advertising: ACoS and TACoS.
Understanding Amazon PPC ACoS
ACoS (Advertising Cost of Sale) represents your advertising spend as a percentage of attributed sales:
ACoS = Advertising Spend ÷ Attributed Advertising Sales × 100%
For example, if you spent $100 on advertising and generated $500 in attributed sales, your ACoS would be 20% ($100 ÷ $500 × 100%).
This metric provides a direct measure of advertising efficiency, telling you how much you’re spending to generate each dollar of ad-attributed revenue. Lower ACoS percentages indicate more efficient advertising, while higher percentages mean you’re spending more to generate each sale.
What is TACoS and How Does It Differ?
TACoS (Total Advertising Cost of Sale) expands the perspective to evaluate advertising spend against total sales, not just attributed sales:
TACoS = Advertising Spend ÷ Total Sales × 100%
Using the same example, if your $100 in ad spend generated $500 in attributed sales, but your product actually sold $1,000 in total (including organic sales), your TACoS would be 10% ($100 ÷ $1,000 × 100%).
This broader metric helps you understand how your advertising investment impacts your overall business performance, capturing the halo effect of advertising on organic sales and brand building.
Strategic Application: When to Focus on Each Metric
Both metrics serve important but distinct purposes in your advertising strategy:
Focus on ACoS when:
- Evaluating individual campaign performance
- Comparing similar campaigns against each other
- Making tactical bid and keyword adjustments
- Setting performance targets for specific ad groups
- Managing short-term profitability
Focus on TACoS when:
- Assessing overall advertising strategy
- Evaluating brand-building effectiveness
- Measuring advertising impact on catalog performance
- Making budget allocation decisions across products
- Planning long-term growth strategies
The most sophisticated Amazon advertising management services integrate both metrics into their analysis, using ACoS for tactical optimization while leveraging TACoS for strategic direction and budget planning.
What Are the 5 Essential Weekly Metrics for Amazon Advertisers?
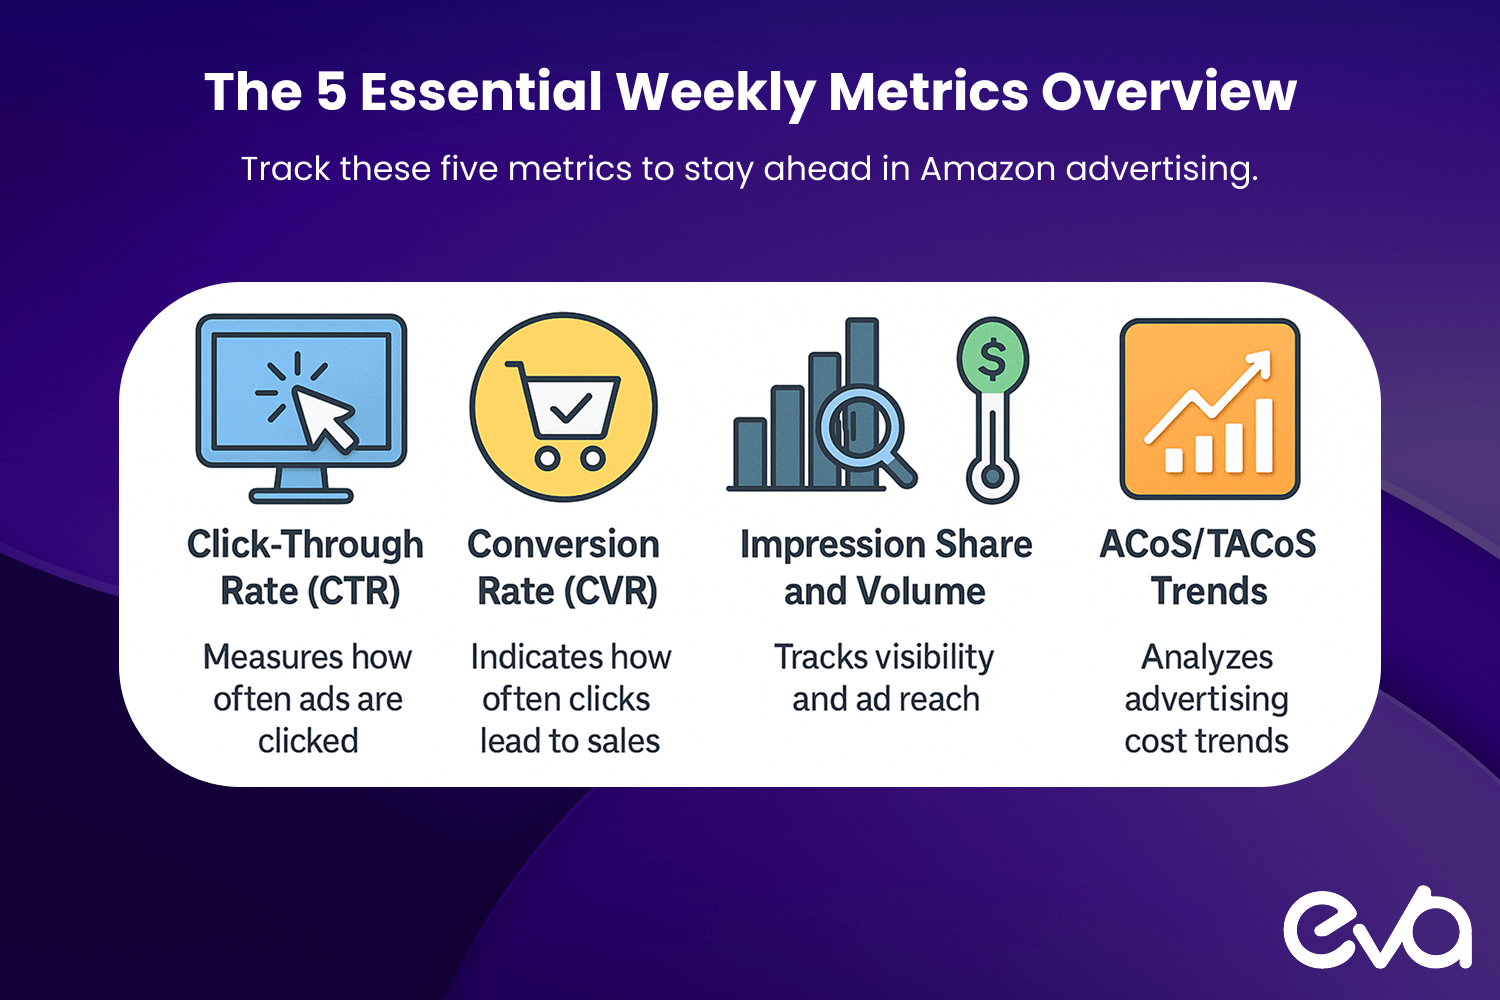
While daily monitoring may be too reactive and monthly reviews too infrequent, weekly analysis provides the optimal cadence for most Amazon advertisers. These five metrics form the core of an effective weekly review process.
1. Click-Through Rate (CTR)
CTR measures the percentage of ad impressions that result in clicks:
CTR = Clicks ÷ Impressions × 100%
Why CTR matters:
- Indicates ad relevance and appeal to shoppers
- Directly impacts advertising costs and efficiency
- Provides insight into creative effectiveness
- Influences Quality Score and placement eligibility
- Helps identify targeting problems early
Weekly analysis questions:
- How does your CTR compare to previous weeks?
- Which campaigns or ad groups show significant CTR changes?
- Are seasonal factors influencing current performance?
- How do your top keywords compare against category benchmarks?
- What patterns emerge when comparing ad types and placements?
For most product categories, a healthy Sponsored Products CTR falls between 0.3% and 0.5%, while Sponsored Brands typically achieve 0.4% to 0.7%. Significant deviations from your established baseline warrant immediate investigation.
2. Conversion Rate (CVR)
CVR measures the percentage of ad clicks that result in purchases:
CVR = Orders ÷ Clicks × 100%
Why CVR matters:
- Directly impacts campaign profitability
- Indicates product page effectiveness
- Helps identify targeting quality issues
- Reveals potential product or pricing problems
- Serves as an early warning system for listing issues
Weekly analysis questions:
- How has CVR changed week-over-week?
- Which campaigns show conversion rate fluctuations?
- Are there correlations between CVR changes and recent listing updates?
- How do conversion rates vary by match type and targeting method?
- Do specific times or days show conversion rate patterns?
Average conversion rates typically range from 8% to 15% for Sponsored Products campaigns, with significant variation based on price point and category. Sustained CVR declines often indicate problems with your product listing rather than your advertising strategy.
3. Impression Share and Volume
Impression metrics capture both the total exposure your ads receive and your share of available impressions:
Impression Share = Your Ad Impressions ÷ Total Available Impressions × 100%
Why impressions matter:
- Indicates advertising reach and visibility
- Reveals scaling opportunities or limitations
- Helps identify budget constraints
- Provides competitive positioning insight
- Essential for new product launch monitoring
Weekly analysis questions:
- How has your impression volume trended over the past 4-6 weeks?
- Which campaigns are limited by budget rather than targeting?
- What is your impression share for branded terms versus category terms?
- How do impression patterns align with your business objectives?
- Are there untapped impression opportunities in specific placements?
While total impression volume varies dramatically by category and budget, your impression share for branded terms should typically exceed 90%, while category term share may range from 10% to 40% depending on competition and budget allocation.
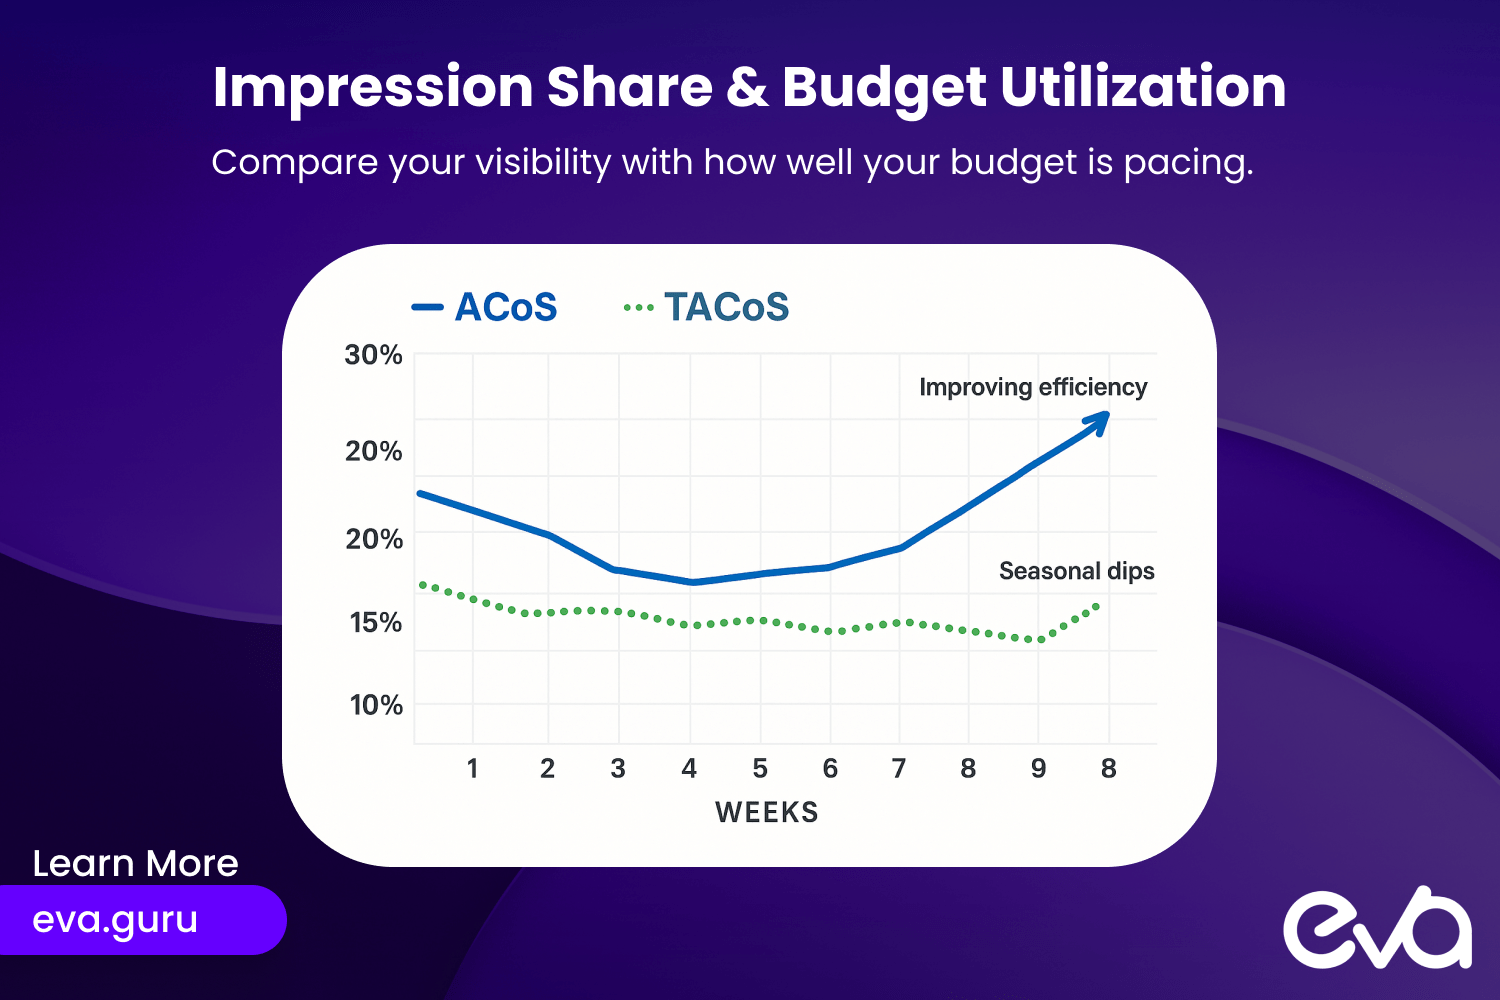
4. Budget Utilization and Pacing
Budget metrics evaluate how effectively you’re deploying your advertising investment:
Budget Utilization = Actual Spend ÷ Allocated Budget × 100%
Why budget utilization matters:
- Prevents missed opportunities from underutilization
- Avoids unexpected overspending
- Ensures proper resource allocation
- Helps identify campaigns requiring budget adjustments
- Supports more accurate forecasting
Weekly analysis questions:
- Which campaigns consistently exceed or underspend their budgets?
- How does day-of-week spending differ from your expectations?
- Are seasonal factors affecting current budget utilization?
- Which campaigns deliver the best return on incremental budget?
- How has spending efficiency changed with recent budget adjustments?
Ideally, campaigns targeting branded terms and high-converting keywords should utilize 90-100% of their daily budgets, while broader discovery campaigns might target 70-85% utilization for optimal efficiency.
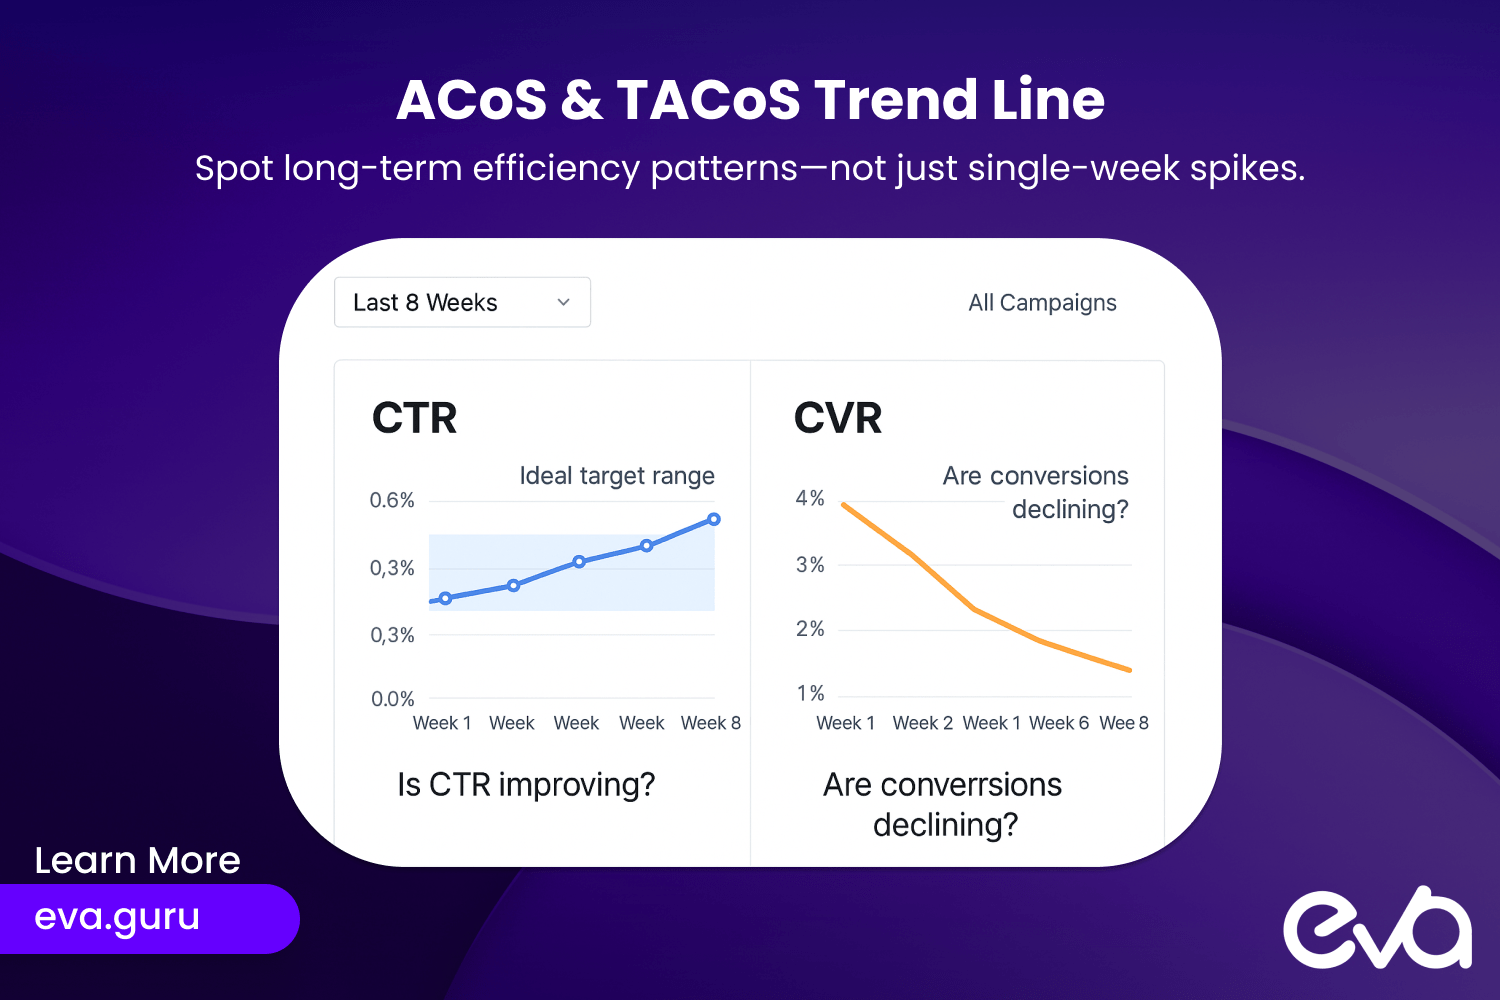
5. ACoS/TACoS Trends
While individual ACoS and TACoS values provide point-in-time efficiency measures, trend analysis reveals the trajectory of your advertising performance:
Why ACoS/TACoS trends matter:
- Highlight improving or deteriorating efficiency
- Reveal seasonal impacts on advertising performance
- Identify the effects of competitive changes
- Show the results of optimization efforts
- Provide early warning for strategy adjustments
Weekly analysis questions:
- How has your overall ACoS trended over the past 4-8 weeks?
- Which campaigns show improving or declining efficiency?
- How does your TACoS trajectory align with business objectives?
- What correlation exists between ACoS changes and other metrics?
- Are efficiency changes driven by CPC fluctuations or conversion changes?
Rather than focusing solely on absolute values, pay particular attention to directional changes and acceleration. A gradual 0.5% weekly improvement in ACoS might not seem significant initially, but represents a substantial 26% annual efficiency gain if sustained.
How Do Benchmarks Vary by Product Category?
Understanding how your metrics compare to category norms helps you set realistic targets and identify true opportunities for improvement.
Typical Metric Benchmarks by Category
While individual products vary significantly, these ranges provide general guidelines for established categories:
| Category | Typical ACoS | Average CTR | Average CVR |
| Beauty & Personal Care | 15-25% | 0.35-0.55% | 10-15% |
| Home & Kitchen | 18-30% | 0.30-0.45% | 8-12% |
| Electronics | 10-20% | 0.25-0.40% | 5-10% |
| Clothing & Accessories | 22-35% | 0.40-0.60% | 7-12% |
| Toys & Games | 20-30% | 0.45-0.65% | 10-18% |
| Health & Household | 15-25% | 0.30-0.50% | 9-14% |
| Pet Supplies | 20-30% | 0.35-0.55% | 10-16% |
| Sports & Outdoors | 18-28% | 0.30-0.50% | 8-13% |
These ranges reflect typical performance for established products with optimized listings. New product launches or highly competitive niches may experience metrics outside these ranges during initial phases.
Finding and Interpreting Industry Benchmarks
To develop more precise benchmarks for your specific products:
- Consult industry reports: Organizations like Marketplace Pulse, Jungle Scout and Eva publish regular benchmark reports
- Analyze brand analytics: If brand registered, compare your performance to top products in your category
- Network with seller communities: Participate in forums where sellers share anonymized metrics
- Review agency case studies: Many Amazon advertising management services publish category-specific case studies
- Build internal benchmarks: Track your own historical performance to establish baseline expectations
When evaluating benchmarks, always consider factors like:
- Price point relative to category average
- Product lifecycle stage
- Seasonality effects
- Competitive density
- Listing quality and review count
Interpreting Performance Against Benchmarks
Performance relative to benchmarks should inform your strategy, but context matters:
If your metrics exceed benchmarks:
- You may have room to scale by increasing bids or budgets
- Consider expanding to new targeting methods or ad types
- Focus on maintaining efficiency while growing volume
- Document your approach to replicate success with other products
- Protect your advantage through defensive targeting strategies
If your metrics fall below benchmarks:
- Prioritize identifying specific underperforming elements
- Evaluate whether listing improvements should precede advertising changes
- Consider testing more conservative targeting and bidding strategies
- Analyze high-performing competitors for strategic insights
- Develop a phased improvement plan with specific metric targets
Remember that exceeding benchmarks isn’t always positive—an extremely low ACoS might indicate missed growth opportunities, while metrics far above norms may signal fundamental product or market fit issues.
What Reporting Tools and Dashboards Should You Use?
Effective metric tracking requires the right tools to collect, analyze, and visualize your advertising data.
Essential Tools for Tracking Amazon PPC ACoS and Beyond
Several solutions can streamline your weekly metric analysis:
Amazon Native Tools:
- Advertising Console: Provides baseline performance data directly from Amazon
- Brand Analytics: Offers competitive insights and search term reports
- Amazon Marketing Cloud: Enables deeper attribution analysis (for eligible advertisers)
Third-Party Solutions:
- Reporting platforms: Tools like Helium 10 and Jungle Scout offer enhanced analytics
- Data visualization tools: Tableau, Power BI, or Google Data Studio for custom dashboards
- Spreadsheet templates: Excel or Google Sheets with predefined formulas and charts
Custom Solutions:
- API-based reporting: Automated data extraction for large-scale sellers
- Business intelligence integrations: Connecting Amazon data with broader business metrics
- Multi-channel dashboards: Unified reporting across Amazon and other platforms
The right solution depends on your budget, technical capabilities, and analytical needs. Many sellers start with spreadsheet templates and gradually move to more sophisticated platforms as their advertising programs scale.
How Amazon Advertising Management Services Automate Reporting
Professional Amazon advertising management services typically offer significant advantages in reporting capabilities:
- Proprietary dashboards: Custom-built analytics platforms designed specifically for Amazon advertising
- Automated data processing: Scheduled data extraction and transformation for consistent analysis
- Cross-client benchmarking: Anonymized performance comparisons across similar products
- Anomaly detection: Automated alerts for statistical outliers and performance shifts
- Forecasting capabilities: Predictive analytics based on historical patterns and seasonal trends
These advanced capabilities enable more sophisticated strategy development and faster tactical adjustments than typically possible with manual analysis.
Essential Dashboard Features
Whether building your own reporting solution or evaluating third-party options, prioritize these critical features:
- Trend visualization: Clear presentation of metric changes over time
- Drill-down capabilities: Ability to move from summary data to specific campaigns or keywords
- Custom date ranges: Flexibility to analyze weekly, monthly, and custom periods
- Benchmark comparison: Visual indicators showing performance against targets
- Export functionality: Options to share or further analyze the data
- Automated calculation: Built-in formulas for derived metrics like TACoS
- Alert functionality: Notifications when metrics exceed thresholds
- Device breakdown: Segmentation by mobile, desktop, and other device types
- Placement analysis: Performance comparison across different ad placements
The most effective dashboards balance comprehensive data with clarity and usability, presenting complex information in actionable formats.
Key Questions to Ask When Reviewing Your Weekly Metrics
The true value of metric tracking comes from the insights and actions it generates. Ask these questions during your weekly review to extract maximum value from your data.
Performance Evaluation Questions
Start by assessing overall performance against your established targets:
- How do current results compare to your target KPIs?
- Which campaigns are exceeding expectations, and which are underperforming?
- Are efficiency metrics (ACoS/TACoS) moving in the right direction?
- How has performance changed relative to the previous week?
- Are you seeing expected returns from recent optimizations?
These foundational questions establish the context for deeper analysis and help prioritize your focus areas.
Action-Oriented Analysis
Move beyond observation to identify specific opportunities for improvement:
- Which keywords or targets warrant bid increases based on performance?
- What underperforming keywords should be paused or have bids reduced?
- Which campaigns need budget adjustments to prevent missed opportunities?
- What negative keywords should be added based on search term performance?
- Are there new keywords or product targets worth testing based on competing product performance?
The goal is to translate metric analysis into a concrete action plan that can be implemented immediately following your review.
Trend Identification and Early Warning
Look beyond immediate performance to identify emerging patterns:
- Are there gradual changes in key metrics that indicate larger trends?
- How do current performance patterns compare to similar periods last year?
- Are competitors’ actions impacting your metrics in identifiable ways?
- What leading indicators suggest future performance changes?
- Are certain products or campaigns showing early signs of trouble?
Proactive identification of trends allows you to address issues before they significantly impact overall performance and capitalize on opportunities before competitors.
Conclusion: Leveraging Metrics for Long-Term Growth
Consistent tracking of the right metrics forms the foundation of successful Amazon advertising, but it’s the application of these insights that ultimately drives results.
Next Steps for Optimizing Your Amazon Advertising
To enhance your metric-driven optimization process:
- Establish a consistent weekly review routine: Schedule a dedicated time for comprehensive analysis
- Document your baseline metrics: Create benchmarks for your ongoing performance evaluation
- Implement an action log: Track optimization changes and their resulting impact
- Develop custom targets by campaign type: Set appropriate goals based on campaign objectives
- Create a tiered alert system: Establish thresholds for immediate action versus monitoring
- Build a testing roadmap: Use metric insights to guide structured experimentation
- Integrate advertising data with broader business metrics: Connect advertising performance to inventory, profitability, and growth objectives
This structured approach transforms metric tracking from a passive reporting exercise into a dynamic optimization system that continuously improves your advertising performance.
Final Thoughts on Metric-Driven Advertising Management
The most successful Amazon advertisers distinguish themselves not by having access to exclusive tactics or secret techniques but through superior execution of fundamental principles. Consistent, thoughtful analysis of these five essential metrics – CTR, CVR, impressions, budget utilization, and ACoS/TACoS trends – provides the foundation for data-driven decisions that drive sustainable growth.
Whether you’re managing campaigns independently or partnering with Amazon advertising management services, this metrics-focused approach will help you maximize return on your advertising investment while building a scalable framework for continued optimization.
Frequently Asked Questions About Amazon Advertising Metrics
For most sellers, an effective weekly analysis requires 1-2 hours of focused attention, depending on account size and complexity. This investment typically delivers significant returns through improved efficiency and performance. Rather than trying to minimize this time commitment, focus on maximizing its productivity by developing streamlined processes, using appropriate tools, and maintaining consistent documentation. The most successful sellers often follow a structured format that allows them to quickly identify changes requiring attention while maintaining awareness of broader performance trends.
While monitoring metrics daily can provide useful insights, most bid adjustments should be based on weekly or longer data periods to avoid overreacting to normal performance fluctuations. Daily data simply doesn’t provide sufficient statistical significance for most products to make confident optimization decisions. However, there are exceptions: during major sales events, product launches, or when addressing specific performance issues, more frequent adjustments may be warranted. The key is distinguishing between normal variance and meaningful changes requiring immediate action.
Target ACoS should be derived from your specific business economics rather than industry benchmarks. Calculate your break-even ACoS by determining your net margin after all costs (product cost, shipping, Amazon fees), then adjust this figure based on your strategic objectives. Products in growth phase might target ACoS near break-even to maximize market share, while established products typically target 20-30% below break-even to ensure profitability. Products with strong repeat purchase patterns can often justify higher ACoS targets to acquire initial customers. Review and adjust these targets quarterly as your costs, pricing, and objectives evolve.
New product launches require different metric expectations and tracking approaches than established products. For new launches, focus on impression growth rate, CTR relative to category averages, and conversion trends rather than absolute ACoS. Establish separate reporting views for launch-phase products (typically the first 60-90 days) with appropriate growth-focused targets. Track new products’ progress through defined stages: visibility building (impressions focus), traffic generation (clicks focus), conversion optimization, and finally efficiency improvement (ACoS focus). This staged approach prevents premature optimization that could stifle a product’s growth potential.
Distinguishing between the impact of your optimizations and external factors requires both contextual analysis and controlled implementation. First, maintain a detailed log of all campaign changes with timestamps. Second, implement significant changes to only some campaigns or ad groups while maintaining others as control groups when possible. Third, compare performance changes against category-wide trends using Brand Analytics benchmarks. Fourth, analyze performance across different targeting types simultaneously (e.g., ASIN targeting versus search) to identify platform-wide shifts. Finally, consider seasonal patterns and year-over-year comparisons to isolate true performance changes from cyclical variations.
How Eva Elevates Your Amazon Advertising Performance
At Eva, we combine advanced AI technology with experienced e-commerce experts to deliver superior advertising performance through sophisticated metric analysis and strategic optimization.
Eva’s Metric-Driven Advertising Solutions
Our comprehensive approach to Amazon advertising management includes:
- AI-Powered Hourly Optimization: Continuous metric monitoring and real-time bid adjustments
- Custom Performance Dashboards: Intuitive visualization of your key metrics and trends
- Cross-Account Benchmarking: Anonymized performance comparison against similar products
- Predictive Analytics: Forward-looking insights based on historical patterns and market trends
- Integrated Profit Analysis: True performance measurement beyond standard advertising metrics
The Eva Advantage: Scientific Approach to Advertising Management
Eva’s methodology delivers superior results through:
- Comprehensive Data Integration: Combining advertising, catalog, inventory, and competitive metrics
- Multi-Dimensional Analysis: Evaluating performance across targeting types, placements, and devices
- Automated Anomaly Detection: Instant identification of significant performance changes
- Structured Optimization Framework: Systematic testing and implementation of strategic improvements
- Custom Attribution Modeling: Advanced analysis of advertising impact beyond Amazon’s attribution window
Is Eva Right for Your Amazon Business?
Eva works with brands of all sizes who want to maximize the effectiveness of their Amazon advertising through sophisticated metric analysis and strategic optimization. Whether you’re just beginning your advertising journey or managing complex campaigns across multiple marketplaces, our scalable solutions can be tailored to your specific needs and objectives.
Ready to discover how Eva can transform your Amazon advertising performance? Claim your free audit and forecast today by visiting www.eva.guru.
Eva is an AI-powered full-service e-commerce agency specializing in Amazon, Walmart, and omnichannel platforms. Our team combines advanced AI technology with experienced e-commerce experts to deliver sustainable growth and profitability for sellers.
We work with brands at every stage of growth who are looking to maximize their advertising performance through data-driven strategy and comprehensive marketplace optimization.