Eva Research / Amazon advertising
The State of Amazon Ads for $1M to $20M Brands (October 2026)
By Hai Mag, CEO, Eva Commerce
Published: October 26, 2026 · Data period: July 27 to October 24, 2026 (90 days, Amazon US) · Download the benchmark table (CSV)
Summary
Short answer: The median Amazon US brand doing $1M to $20M a year ran a 28.4% ACoS and a 10.6% TACoS over the 90 days from July 27 to October 24, 2026, based on 150 brand accounts. Larger brands spent a smaller share of total sales on ads (median TACoS of 11.2% at $1M to $3M vs 9.7% at $8M to $20M), even though their ACoS was not lower. Sponsored Products took 77% of ad spend, and Sponsored Display was the least efficient ad type at a 38.3% median ACoS.
Key findings
- The median $1M to $20M Amazon brand ran a 28.4% ACoS and a 10.6% TACoS in the 90 days to October 24, 2026, with a median ROAS of 3.53 and a median cost per click of $1.07.
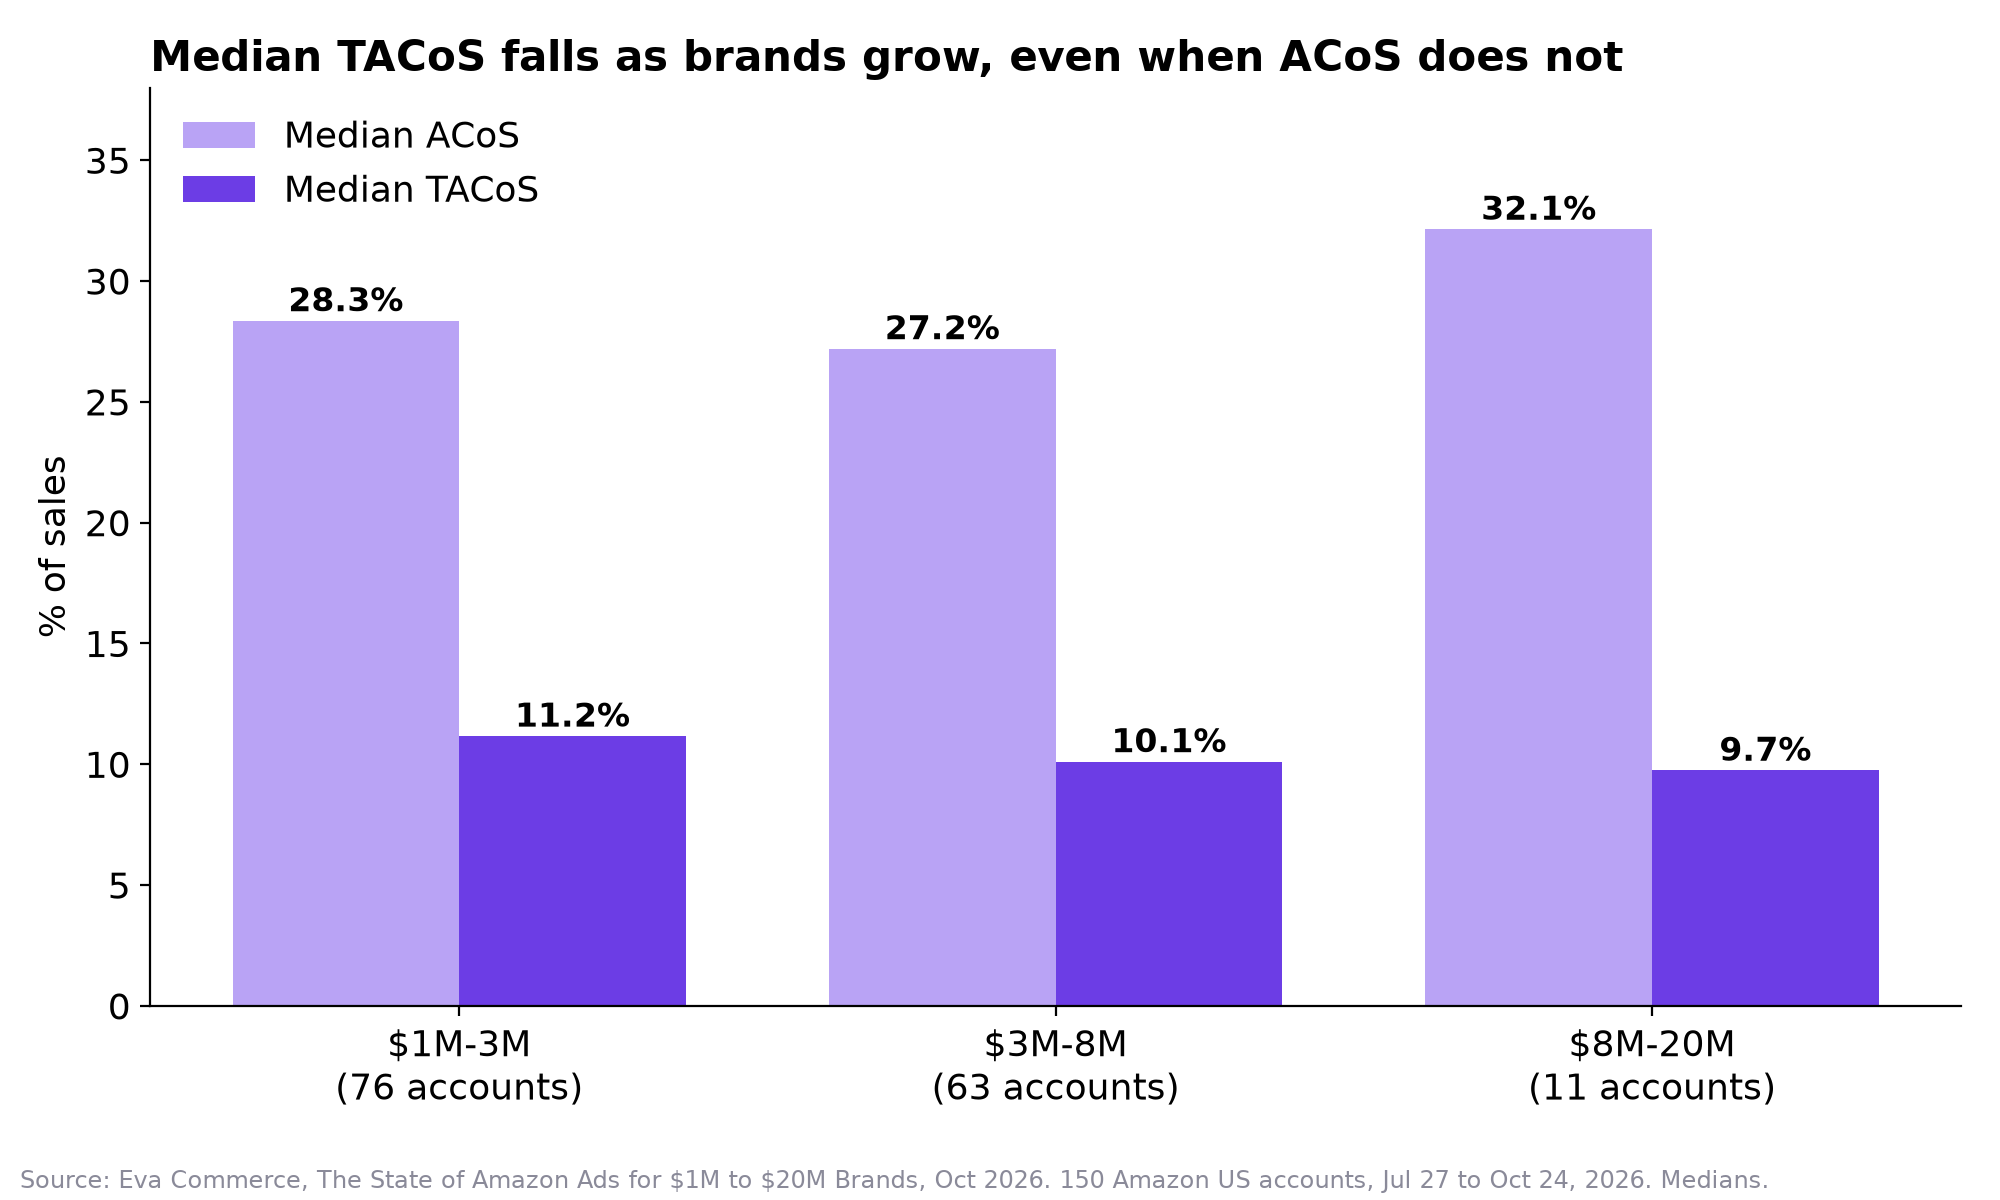
- Median TACoS drops from 11.2% for $1M to $3M brands to 10.1% for $3M to $8M and 9.7% for $8M to $20M brands, while median ACoS was highest in the largest band at 32.1%, so the bigger brands rely less on ads for each dollar of total sales.
- Sponsored Display had the highest median ACoS of any Amazon ad type at 38.3%, compared with 27.7% for Sponsored Products and 26.7% for Sponsored Brands, and 90% of brands running Sponsored Display paid a higher ACoS on it than on Sponsored Products.
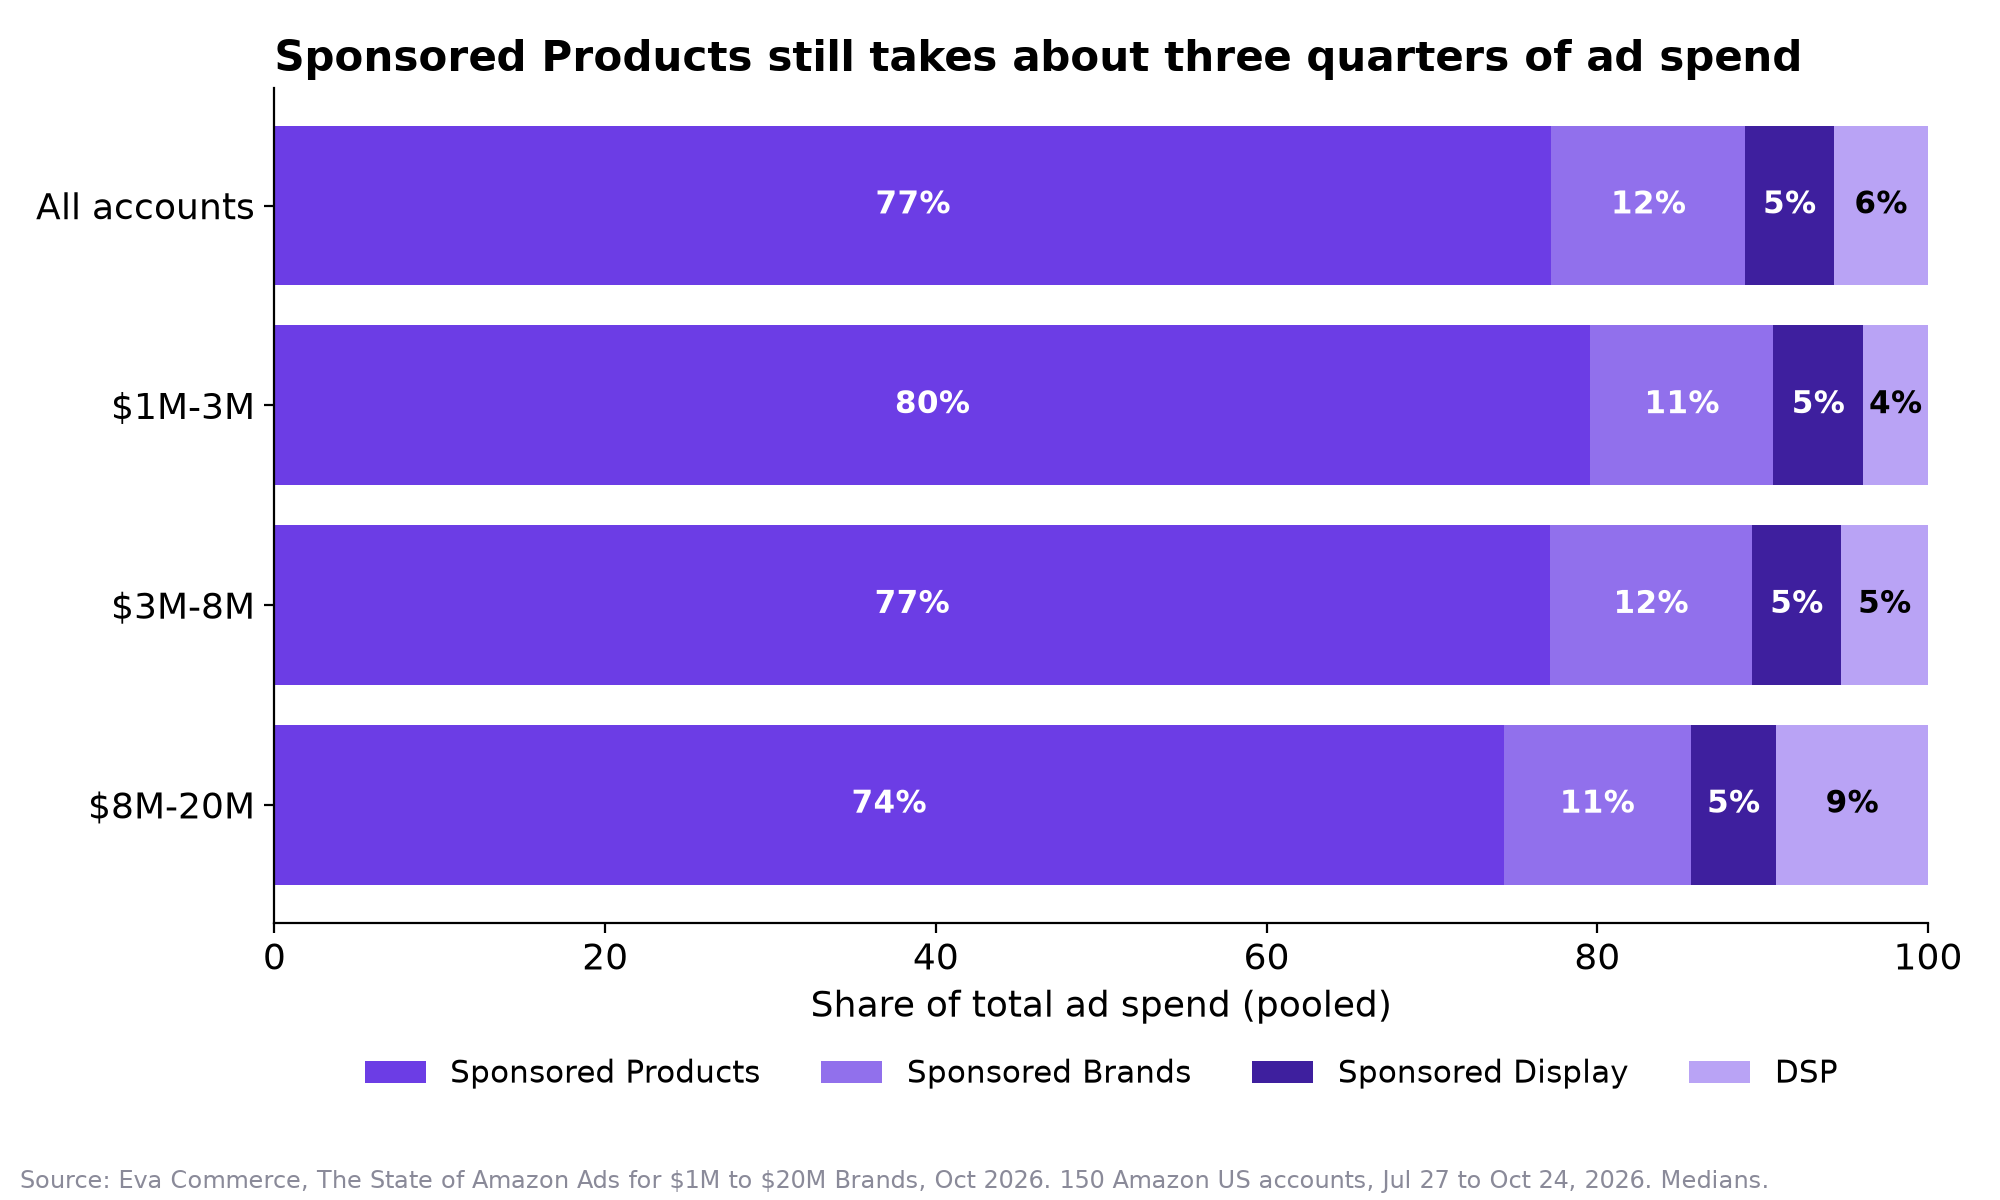
- Sponsored Products still takes 77% of all ad spend for $1M to $20M brands, with Sponsored Brands at 12%, DSP at 6% and Sponsored Display at 5%.
- DSP use more than doubles with size, from 25% of $1M to $3M brands to 55% of $8M to $20M brands, and DSP users paid a higher median CPC ($1.27 vs $0.99) but ran a lower median TACoS (9.9% vs 10.8%) than brands without DSP.
Benchmarks at a glance
All figures are medians across accounts unless marked pooled. Pooled means total spend divided by total sales (or clicks, or orders) across every account in the group, so bigger accounts count more.
Overall (150 accounts)
| Metric | P25 | Median | P75 | Pooled |
|---|---|---|---|---|
| ACoS | 23.8% | 28.4% | 33.7% | 27.6% |
| TACoS | 8.1% | 10.6% | 12.8% | 10.7% |
| ROAS | 2.97 | 3.53 | 4.21 | 3.62 |
| CPC | $0.79 | $1.07 | $1.47 | $0.99 |
| Conversion rate (orders / clicks) | 8.7% | 11.2% | 13.4% | 10.7% |
| CTR | 0.34% | 0.41% | 0.52% | 0.41% |
| Ad sales share of total sales | 28.0% | 36.3% | 48.0% | 38.9% |
By revenue band (annualized Amazon sales)
| Band | Accounts | ACoS | TACoS | ROAS | CPC | CVR | CTR | Ad sales share |
|---|---|---|---|---|---|---|---|---|
| $1M to $3M | 76 | 28.4% | 11.2% | 3.53 | $1.07 | 10.5% | 0.41% | 37.5% |
| $3M to $8M | 63 | 27.2% | 10.1% | 3.68 | $1.07 | 11.2% | 0.42% | 36.4% |
| $8M to $20M | 11 | 32.1% | 9.7% | 3.11 | $1.32 | 12.0% | 0.34% | 33.0% |
The $8M to $20M band has 11 accounts, so read it as directional. We do not break it down by category.
By category group
| Category group | Accounts | ACoS | TACoS | ROAS | CPC | CVR | CTR | Ad sales share |
|---|---|---|---|---|---|---|---|---|
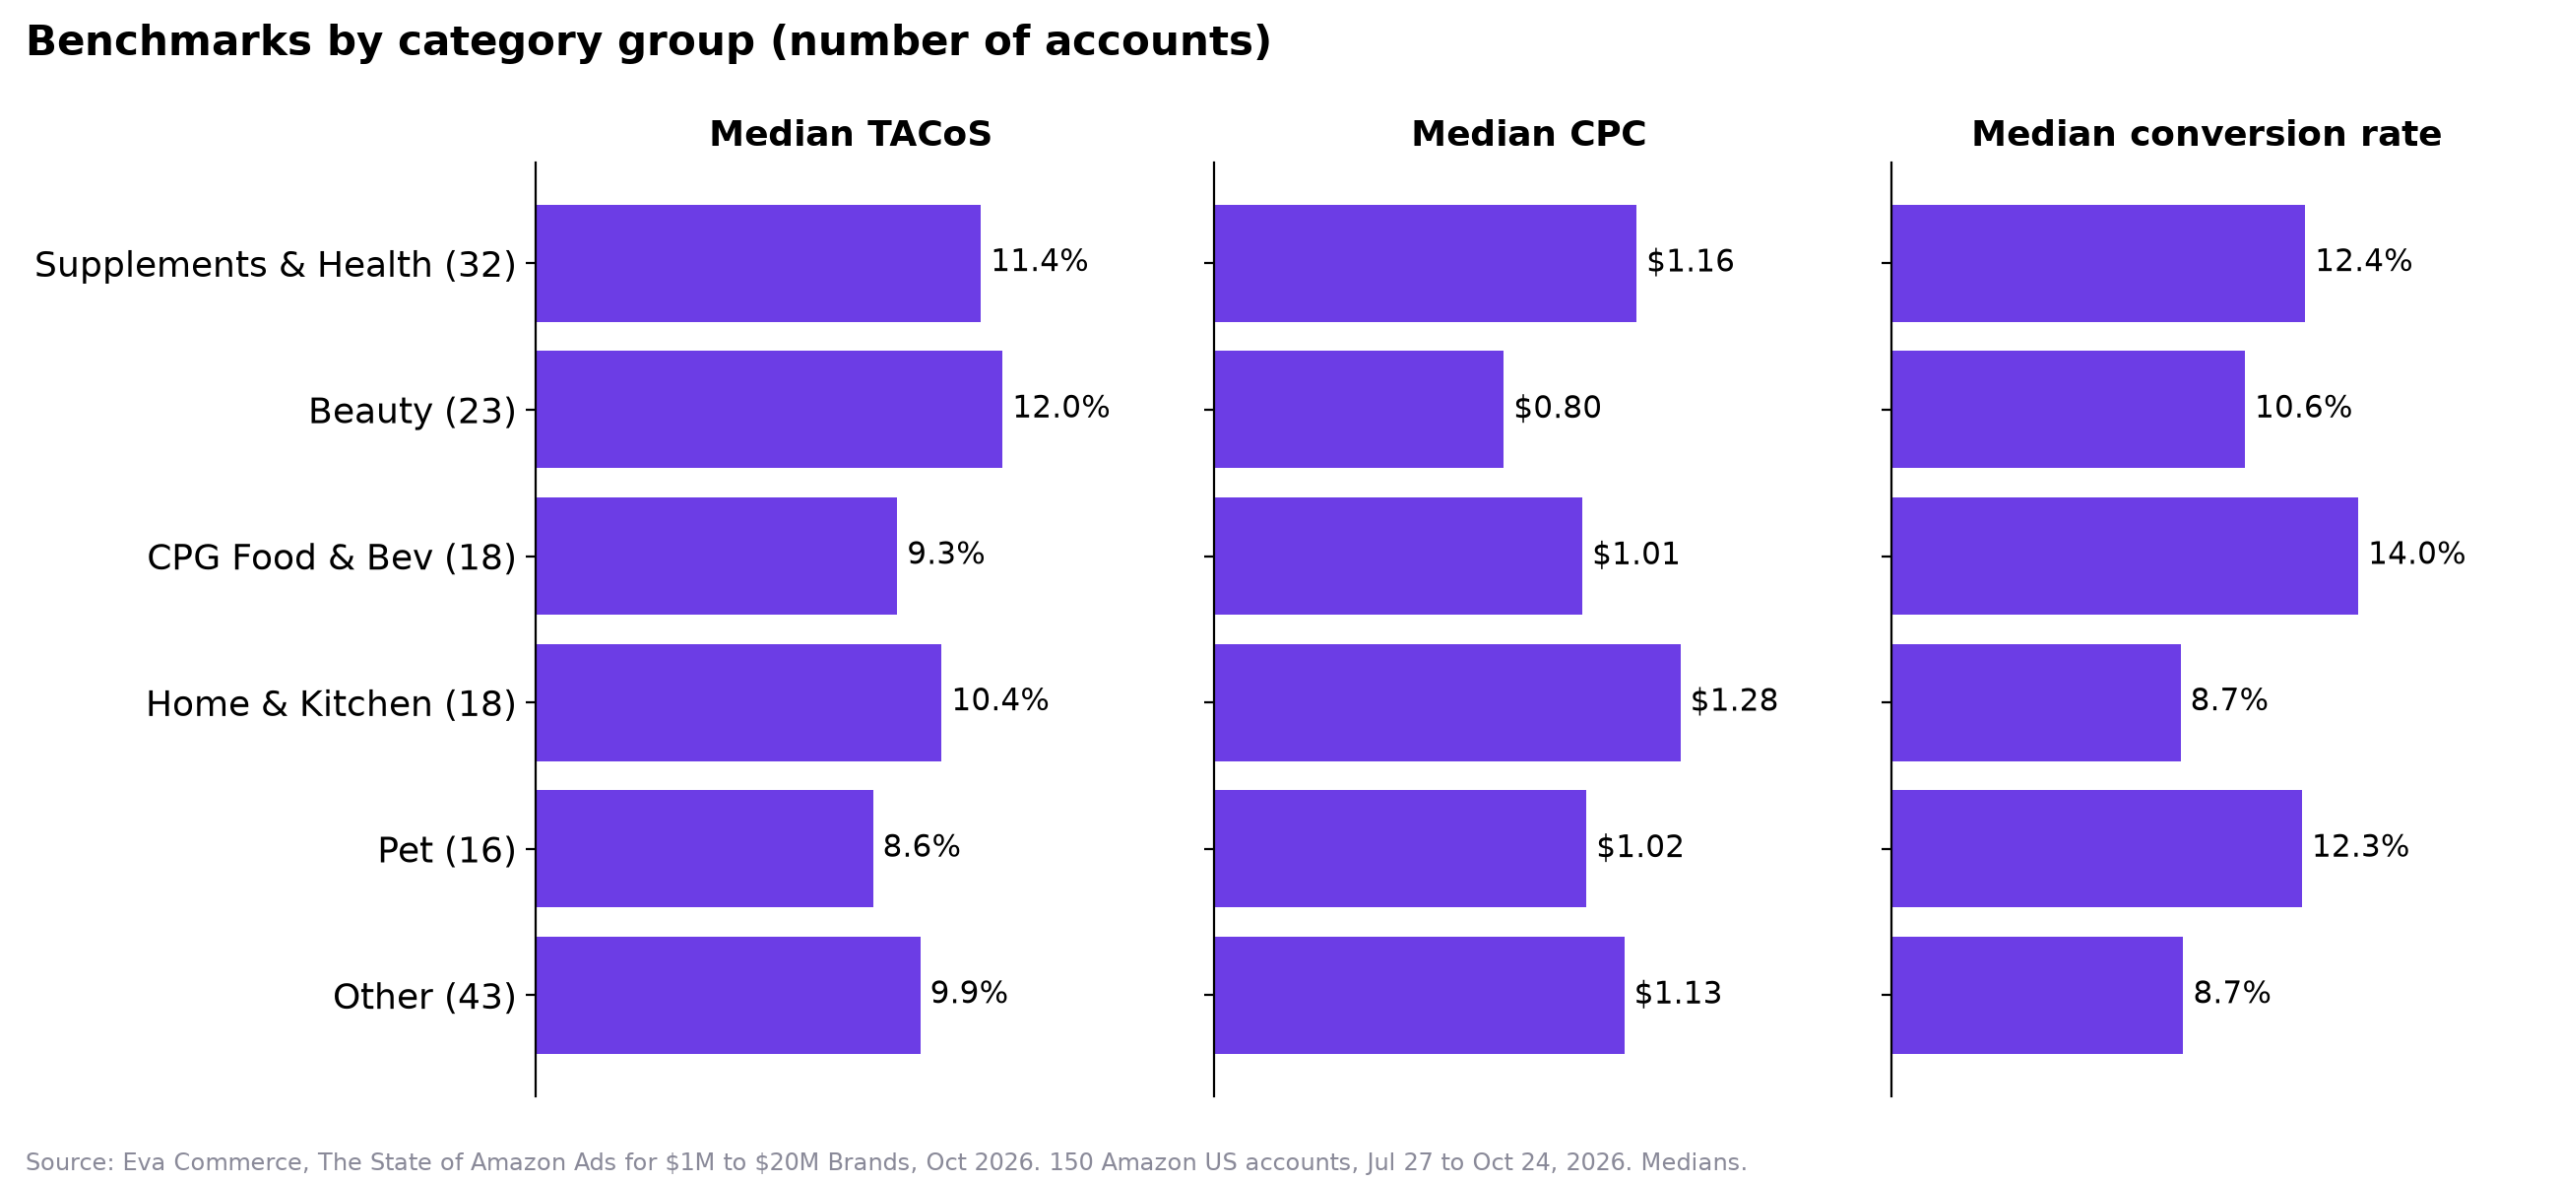
| Supplements & Health (Health & Household) | 32 | 28.4% | 11.4% | 3.52 | $1.16 | 12.4% | 0.41% | 41.6% |
| Beauty (Beauty & Personal Care) | 23 | 28.5% | 12.0% | 3.51 | $0.80 | 10.6% | 0.43% | 40.6% |
| CPG Food & Bev (Grocery & Gourmet Food) | 18 | 26.6% | 9.3% | 3.76 | $1.01 | 14.0% | 0.54% | 34.3% |
| Home & Kitchen | 18 | 27.4% | 10.4% | 3.65 | $1.28 | 8.7% | 0.37% | 38.1% |
| Pet (Pet Supplies) | 16 | 28.9% | 8.6% | 3.46 | $1.02 | 12.3% | 0.40% | 34.0% |
| Other | 43 | 29.6% | 9.9% | 3.38 | $1.13 | 8.7% | 0.39% | 33.6% |
“Other” covers Tools & Home Improvement, Sports & Outdoors, Toys & Games, Clothing, Shoes & Jewelry, Patio, Lawn & Garden, Office Products and Baby.
What stands out: Beauty had the cheapest clicks ($0.80) but the highest TACoS (12.0%). Grocery brands converted best (14.0%). Home & Kitchen paid the most per click ($1.28) and converted lowest (8.7%, tied with Other). Pet ran the lowest TACoS at 8.6%.
Where the ad budget goes
Spend mix (pooled share of total ad spend)
| Group | Sponsored Products | Sponsored Brands | Sponsored Display | DSP |
|---|---|---|---|---|
| All accounts | 77.2% | 11.7% | 5.4% | 5.7% |
| $1M to $3M | 79.6% | 11.1% | 5.4% | 3.9% |
| $3M to $8M | 77.1% | 12.2% | 5.4% | 5.2% |
| $8M to $20M | 74.3% | 11.3% | 5.2% | 9.2% |
| Supplements & Health | 77.3% | 10.2% | 5.0% | 7.5% |
| Beauty | 77.9% | 13.1% | 4.9% | 4.0% |
| CPG Food & Bev | 75.7% | 11.9% | 5.2% | 7.2% |
| Home & Kitchen | 76.2% | 12.4% | 5.5% | 5.9% |
| Pet | 76.2% | 11.5% | 6.2% | 6.1% |
| Other | 78.1% | 11.8% | 5.7% | 4.4% |
Who uses which ad type (share of accounts with any spend)
| Group | Sponsored Brands | Sponsored Display | DSP |
|---|---|---|---|
| All accounts | 97.3% | 89.3% | 31.3% |
| $1M to $3M | 97.4% | 90.8% | 25.0% |
| $3M to $8M | 98.4% | 87.3% | 34.9% |
| $8M to $20M | 90.9% | 90.9% | 54.5% |
Every account ran Sponsored Products.
ACoS by ad type
Median ACoS among accounts that ran each ad type.
| Group | Sponsored Products | Sponsored Brands | Sponsored Display | DSP |
|---|---|---|---|---|
| All accounts | 27.7% (150) | 26.7% (146) | 38.3% (134) | 31.8% (47) |
| $1M to $3M | 27.8% | 26.0% | 36.3% | 31.7% |
| $3M to $8M | 26.9% | 26.7% | 38.3% | 31.2% |
| $8M to $20M | 32.6% | 28.6% | 44.6% | 41.3% (6 accounts) |
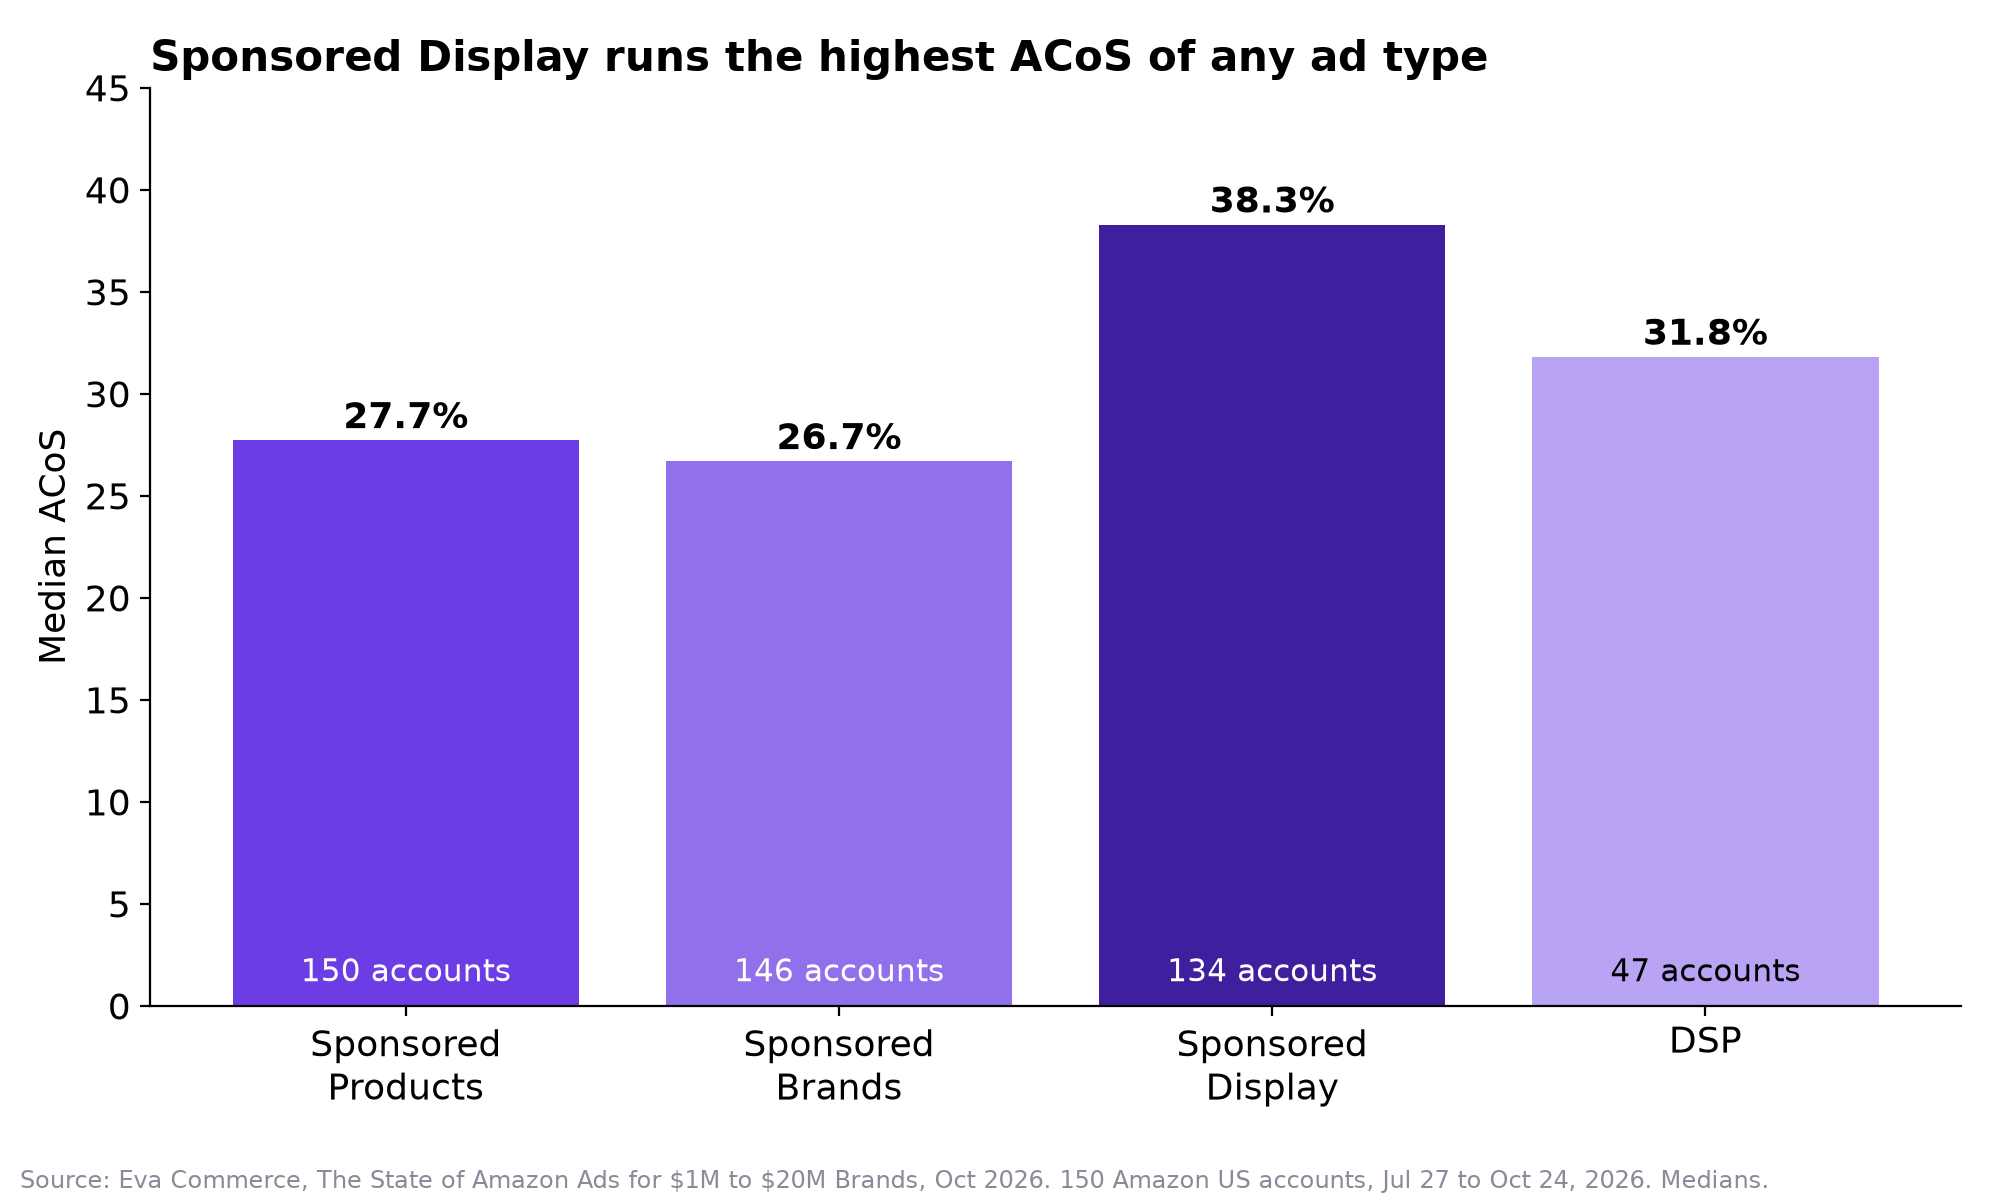
DSP attribution usually includes view-through sales, so DSP ACoS is not a like-for-like comparison with Sponsored Products.
Relationships worth a look
These are correlations in this sample, not proof that one thing causes another.
- Size and TACoS. Median TACoS steps down across the three bands, but the account-level link is weak (rank correlation of -0.13). Size alone explains little of the spread.
- DSP users vs non-users. The 47 DSP users had a median ACoS of 28.6% vs 28.3% for the 103 non-users, a higher median CPC ($1.27 vs $0.99), a higher median conversion rate (12.1% vs 10.1%) and a lower median TACoS (9.9% vs 10.8%). DSP users skew larger, which may explain part of the gap.
- Sponsored Brands and Display share. Splitting accounts into thirds by the share of spend going to Sponsored Brands plus Sponsored Display, median ACoS goes from 29.4% (lowest third) to 27.7% (middle) to 27.2% (highest third). Median TACoS shows no clear pattern (11.2%, 9.9%, 10.6%).
- TACoS and ad dependence. Accounts where ads drive a bigger share of total sales also run a higher TACoS (rank correlation of 0.74). That is expected, but it is the clearest signal in the data: the brands with the lowest TACoS are the ones with the most sales that do not come through ads.
What this means for a connected commerce brand
Amazon ad efficiency is one part of the picture. The brands with the lowest TACoS in this data are the ones where more sales come without an ad click, which usually means strong reviews, good rankings and repeat buyers. A few practical takeaways:
- Judge Amazon ads by TACoS, not only ACoS. A 32% ACoS can be fine if TACoS is under 10% and organic sales are growing.
- Check Sponsored Display first when you cut spend. It is about 5% of budgets but ran a median ACoS more than 10 points above Sponsored Products.
- Own the repeat customer on your own store. Amazon customers belong to Amazon, and we do not recommend contacting Amazon buyers off Amazon. What you can do is give shoppers a reason to find your Shopify store on their own, through your brand name, your content and your social channels, then keep them there with email, SMS and subscriptions. Ravlexo is one of the tools we use with our clients for Shopify retention.
- Let social commerce feed demand. TikTok Shop, Instagram and creator content build brand search. That search shows up on Amazon as cheaper branded clicks and more organic sales, which is what pulls TACoS down over time.
Methodology
- Sample: 150 Amazon US brand-owner accounts that Eva Commerce works with, each with $1M to $20M in annualized Amazon sales. Test, internal and demo accounts were excluded.
- Period: July 27 to October 24, 2026 (90 days). This window includes Amazon’s October Prime Big Deal Days, which usually raise CPCs and sales for a few days.
- Revenue bands: 90-day Amazon sales x 365 / 90, grouped into $1M to $3M (76 accounts), $3M to $8M (63) and $8M to $20M (11). The largest account in the sample annualizes to about $15.6M.
- Inclusion: accounts ran ads in each month of the period and spent at least $3,000 on ads over the 90 days.
- Categories: each account’s main Amazon category, grouped as Supplements & Health (Health & Household), Beauty (Beauty & Personal Care), CPG Food & Bev (Grocery & Gourmet Food), Home & Kitchen, Pet (Pet Supplies) and Other.
- Data sources: Amazon Ads reporting for Sponsored Products, Sponsored Brands, Sponsored Display and Amazon DSP, plus total Amazon sales, pulled through the tools we use with our clients, including Vueria.
- Metric definitions:
- ACoS = ad spend / ad-attributed sales
- TACoS = ad spend / total Amazon sales
- ROAS = ad-attributed sales / ad spend
- CPC = ad spend / clicks
- Conversion rate (CVR) = ad orders / ad clicks
- CTR = clicks / impressions
- Ad sales share = ad-attributed sales / total Amazon sales
- Spend mix = each ad type’s spend / total ad spend (pooled)
- Adoption = share of accounts with any spend on that ad type
- Statistics: headline numbers are medians across accounts, so one large account cannot move them. We also show the 25th and 75th percentiles and pooled (spend-weighted) values.
- Anonymity rule: we publish a group only if it has at least 5 accounts and no single account makes up more than 30% of that group’s ad spend. No brand names or account IDs appear anywhere. Client agreements allow anonymized, aggregated use.
Limitations
- The sample is accounts Eva Commerce works with, not a random sample of all Amazon sellers. Brands that hire an agency may run ads differently from those that do not.
- The $8M to $20M band has only 11 accounts, and only 6 of them ran DSP. Treat those figures as directional.
- 90 days that include Prime Big Deal Days are not a full year. Q4 holiday CPCs will likely be higher.
- Attribution windows differ by ad type (DSP, for example, counts view-through sales), so ACoS across ad types is a guide, not an exact comparison.
- Category is each account’s main category. Brands that sell across categories are counted once.
- The data covers Amazon US only.
FAQ
What is a good ACoS for a $1M to $20M Amazon brand?
The median ACoS was 28.4% across 150 Amazon US brands doing $1M to $20M a year, and the middle half of brands ran between 23.8% and 33.7%. A “good” ACoS depends on your margin, so compare it with your break-even ACoS and look at TACoS alongside it.
What is the average TACoS on Amazon in 2026?
The median TACoS was 10.6% for $1M to $20M brands from July 27 to October 24, 2026, ranging from 11.2% for $1M to $3M brands down to 9.7% for $8M to $20M brands. The middle half of brands ran between 8.1% and 12.8%.
How much does an Amazon ad click cost in 2026?
The median cost per click was $1.07 across all ad types, with Beauty the cheapest at $0.80 and Home & Kitchen the most expensive at $1.28. These figures include October Prime Big Deal Days.
Is Sponsored Display worth it for Amazon brands?
Sponsored Display had a median ACoS of 38.3%, the highest of any ad type, and 90% of brands using it paid more per dollar of sales than on Sponsored Products. It can still play a role in retargeting and defending your listings, but it is usually the first place to look when you need to trim spend.
When should an Amazon brand start using DSP?
In this data, 25% of $1M to $3M brands used Amazon DSP, compared with 35% at $3M to $8M and 55% at $8M to $20M. DSP users had a lower median TACoS (9.9% vs 10.8%), but they also tend to be larger, so test DSP once Sponsored ads are efficient and you have budget to spare.
How to cite this study
Eva Commerce, The State of Amazon Ads for $1M to $20M Brands, October 2026. https://eva.guru/research/state-of-amazon-ads-1m-20m-brands-2026/
You are welcome to quote any number from this page with a link back to it.