fbpx
Get Your Free Copy Of 10 Reasons Not To Choose An Ecommerce Agency For Your Amazon Business Get The PDF
Marketplaces

Gain Control of Your Amazon Business with Accurate Profit Analytics

Success on Amazon starts by knowing your profits, expenses, and fees accurately at store and product level.

Profit Analytics $25/Mo – Unlimited Features – 11% Reimbursement Recovery Fee
Amazon Advanced Ads Min.png
Amazon Global Selling.png
Amazon Marketplace.png
Amazon Freight Partner

Amazon Profit Calculator: Your Key to Informed Decision-Making

Access Ad Spend, Over 100 Amazon Fees, Indirect Expenses, Returns, Reimbursements, Aggregated Marketplace Views, Real-Time Daily Sales, Top Sellers, and Product-Level Analytics – All at Your Fingertips and Exportable.

Get Better Visibility Into Your Operations on Amazon

Access comprehensive insights into your Amazon operations through user-friendly dashboards that utilize real-time analytics to provide essential information and alerts related to your products on Amazon

Store Level.png

Store Level Visibility

Get a birds-eye view of your store’s historical sales & profit analytics, inventory health and advertising performance. Save hours of time compiling reports, avoid extra fees & optimize your operations in a few clicks.

Product Level.png

Product Level Visibility

Get a detailed view of your ASIN’s historical sales & profit analytics, pricing adjustments, inventory health and advertising performance. Seamlessly calculate & monitor each product’s fees, expenses & costs in easy-to-understand dashboards.

Daily Sales.png

Daily Sales Visibility

Eva analytics helps you easily visualize your daily sales, advertising & profit data. The platform uses this data along with demand, trends, category, seasonality & inventory levels to deliver next-best actions to increase revenue and profitability.

Operational.png

Operational Visibility

With Eva Analytics you get easily accessing insights on sales, profit, inventory, and advertising performance. It saves time, minimizes fees, and offers actionable data for revenue and profitability optimization

Comprehensive Report Access for Your Convenience

Visualize your data effortlessly in Eva and export various reports, including sales, inventory, and advertising, with just a single click

Operational Reports 2048x2048

Operational Reports

Analyze daily sales, advertising & profit data to identify top-selling ASINs & trends

Advertising Reports Scaled 1 1536x1536

Advertising Reports

Easily generate advertising reports that quickly segment campaigns, portfolios & products

Pricing Promotion Management Reports Scaled 1 300x300

Pricing & Promotion Management Reports

Quickly generate reports that filter ASINs by fulfillment type & status (inventory, pricing, buy box)

Inventory Reports Scaled 1 300x300

Inventory Reports

Get reports on replenishment forecasting & cost simulations, inventory health, returns and 3PL inventory status

Reimbursement Reports Scaled 1 300x300

Reimbursement Reports

Export detailed categorical breakdowns of successful reimbursement claims by provider

Custom Reports Scaled 1 300x300

Custom Reports

Don’t see the report you’re looking for? Let us know what kind of report you’re looking for & how we can help!

1.png

$6B+

Sales
Generated

2.png

$1.6B+

Ad Spend
Optimized

3.png

51%

Avg. Increase In
Profitability

4.png

40%

Reduction In
Operational Costs

5.png

95%

Reduction In
Stockouts

Analytics Last 1 1387x1536 Min

Optimize Your Amazon
Store's Performance with
Profit Analytics

Track changes in inventory, advertising, sales & profit metrics

Assess real-time performance & define rule-based automations

Bulk upload/export data in CSV or XSLV format

Measure the performance of your store, products & daily sales

Frequently Asked Questions

Yes! You can easily filter & export the data you need or upload an Excel (.xslv) or CSV (.csv) file directly to the Eva platform.

You can view your total sales, including both FBA and FBM sales, as well as advertising and organic sales, alongside all expenses such as Amazon fees, COGS (Cost of Goods Sold), advertising costs, and refunds. This comprehensive view enables you to assess your profitability effectively.

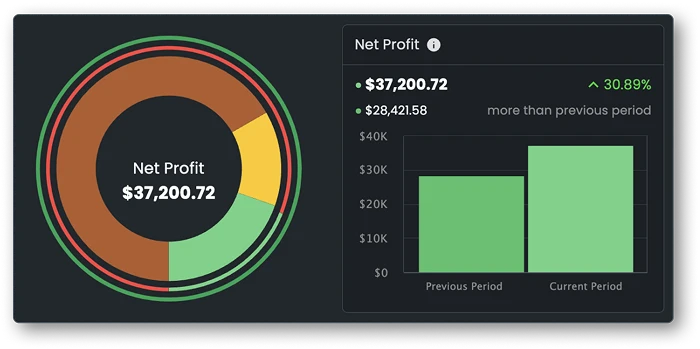
Yes, all metrics are displayed in detailed charts, and you can select predefined periods such as 7 days, 14 days, 30 days, 60 days, last week, current month, and last month. Alternatively, you can choose a custom period. The system will automatically present your metrics in a comparative manner with the previous period.

When a seller connects to the system, data from the past four months is downloaded (for private labels, data from the past twelve months is downloaded), and each day, additional data is accumulated through the syncing process with Amazon. Furthermore, no data is deleted, meaning there is no limit to the amount of data that can be stored. Therefore, as long as you are connected to the system, you can track and compare all of your data.

Yes, you can toggle between your marketplaces to view detailed information for each. Moreover, Eva provides insights into your profit, sales, orders, and unit information across all marketplaces, facilitating comparisons. Additionally, if a marketplace is not connected, you can promptly identify the missing marketplace and establish a connection.

Yes, you can do this individually or in bulk in the Pricing Management settings within the platform.

Yes! You can request up to 5 different customized report through our platform for only one click. ex. Best Seller Rank, Profit Details, SKU Orders, Order Details, Brand Comparison.

Absolutely, you can compare the profitability of your products. Each of your SKUs is tracked with comprehensive performance metrics such as ACoS (Advertising Cost of Sales), Ad SKU Sales, Ad Spend, Attributed Ad Sales, CTR (Click-Through Rate), CVR (Conversion Rate), FBA Fee (Fulfillment by Amazon Fee), FBM Shipping (Fulfillment by Merchant Shipping), Impressions, Margin, Orders, Organic Sales, Product Cost, Product Name, Profit, Referral Fee, Refunds, ROI (Return on Investment), Sessions, Shipping to FBA Cost, TACoS (Total Advertising Cost of Sales), Total Ad Sales, Total Sales, Units Sold, and Stock Levels. You can also adjust the tracking period to either predefined or custom time frames to suit your analysis needs

Of course, By selecting a specific SKU, you gain access to comprehensive performance insights through various analytics. This includes Sales & Profit Analytics, Traffic & Sales Information, Inventory, Reimbursements, and Refund data, all presented in an easy-to-understand chart format. Additionally, you have the flexibility to adjust the tracking period for each chart, allowing you to observe trends and detailed variations over time by selecting from predefined or custom time frames.

We are constantly adding features to enhance the user experience. If you have a suggestion to improve our software, please let us know!

Start Growing Today

Unlock the path to maximize your potential and embrace
 a future of profitability and innovation with Eva.