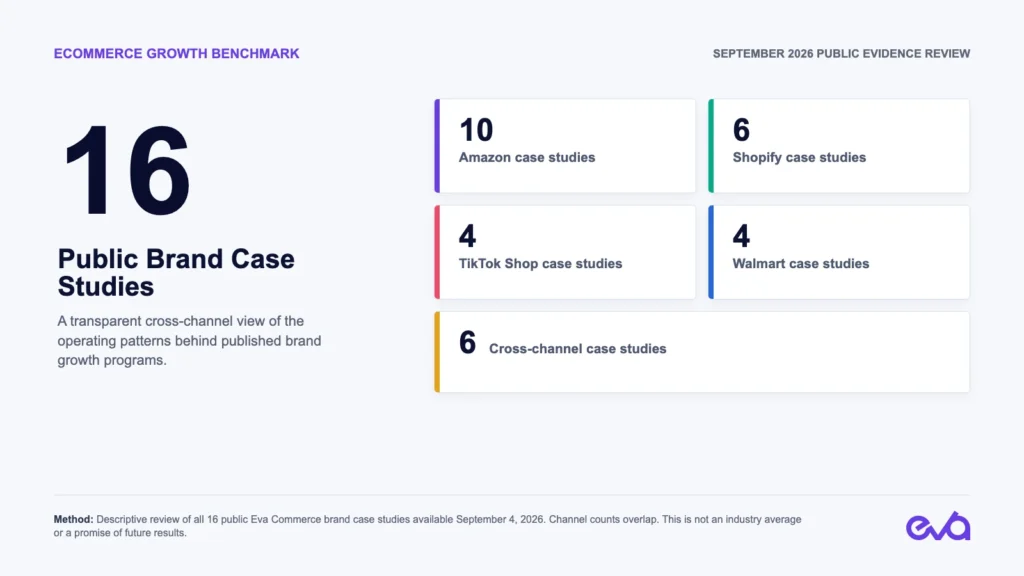
Quick answer: Eva’s 16 public case studies show a repeated operating pattern: profitable growth requires advertising, content, conversion, inventory, operations, and customer value to be managed together. Ten cases include Amazon, six include Shopify, four include TikTok Shop, four include Walmart, and six involve more than one commerce channel. These are portfolio observations, not universal industry averages.
Evidence boundary: This benchmark describes every public case study in Eva’s library as of September 4, 2026. Published case studies are selected engagements, not a random sample. Channel counts and operating themes are reproducible from the linked pages. Individual outcomes do not predict another brand’s result.
Table of Contents
- Methodology and limitations
- The 16-case-study dataset
- Finding 1: Amazon is the most common channel, but media is only one part of the work
- Finding 2: Six cases cross channel boundaries
- Finding 3: Shopify evidence centers on conversion and customer value
- Finding 4: TikTok Shop needs an operating system around creator demand
- Finding 5: Marketplace expansion is an operating decision
- A reproducible profitability scorecard
- How brands should use this benchmark
- Frequently asked questions
Methodology and limitations
The unit of analysis is one public brand case study. Channel coverage was assigned from the visible title, description, and narrative on each page. A case can count toward several channels. Operating themes were recorded only when the public page described the work. No unpublished client data was used.
- Sample: 16 public Eva Commerce case studies.
- Channels counted: Amazon, Shopify, TikTok Shop, and Walmart.
- Snapshot date: September 4, 2026.
- Counted: public channel coverage and described operating focus.
- Not calculated: market averages, medians, causal lift, or expected performance for another brand.
- Selection limit: public case studies are approved examples and may not represent every engagement or all Eva clients.
The 16-case-study dataset
| Brand | Channel coverage | Public operating focus |
|---|---|---|
| Youtooz | Amazon | Marketplace channel development for a large character catalog |
| One Emerald Lane | Amazon + Shopify + Walmart + eBay | Connected advertising, search, catalog, marketplace, and store operations |
| Peru Pima | Shopify | Conversion and peak-period growth |
| Maelys | TikTok Shop + Shopify | Demand, conversion, and profitability |
| Cricket | Amazon | Advertising sales and profitability |
| Ninja | Amazon + Walmart | International and marketplace expansion |
| Happy Products | Amazon | Revenue, profit, and keyword ranking |
| Poppi | TikTok Shop + Shopify | Demand capture and repeat purchase |
| Nature Made | Amazon + Walmart | Cross-marketplace demand activation |
| Neutrogena | Walmart | Marketplace optimization and review syndication |
| Drybar | TikTok Shop | Creator demand and repeatable shop revenue |
| Morinaga | Amazon | International marketplace operations |
| Ritual | Shopify | Subscriptions and retention |
| American Foods | Amazon | Advertising and profit control |
| Chicken of the Sea | Amazon | Vendor recovery and full-funnel advertising |
| Finn | Amazon + Shopify + TikTok Shop | Unified cross-channel growth |
Finding 1: Amazon is the most common channel, but media is only one part of the work
Ten of the 16 public cases include Amazon. Their operating themes extend beyond campaign efficiency to search ranking, catalog health, marketplace operations, inventory, pricing, expansion, vendor recovery, and product-level profit. The evidence does not support one universal ACOS target. It supports a broader question: can the team explain how advertising affects total sales, rank, conversion, inventory, and contribution for each product?
Brands can use Eva’s Amazon advertising benchmark framework to set product-specific objectives and measurement boundaries before comparing performance.
Finding 2: Six cases cross channel boundaries
Maelys, Poppi, Nature Made, Ninja, Finn, and One Emerald Lane involve more than one commerce channel. The mix is not an argument for launching everywhere. It shows why a common economic view matters. TikTok Shop can create demand, Amazon can capture product discovery, Shopify can convert and retain customers, and Walmart or eBay can expand reach. Pricing, inventory, creative, and promotion still need one plan.
Finding 3: Shopify evidence centers on conversion and customer value
Six cases include Shopify. The public work covers product-page conversion, subscription, repeat purchase, retention, paid-media dependency, and turning demand into an owned customer relationship. The useful benchmark is not traffic alone. It is whether acquisition, merchandising, customer data, lifecycle, subscription, and margin decisions reinforce one another.
Finding 4: TikTok Shop needs an operating system around creator demand
Four cases include TikTok Shop. Their public narratives connect creators and content with shop revenue, Shopify conversion, repeat purchase, paid amplification, fulfillment, and cross-channel economics. The management benchmark is continuity: can the team turn creative signals into a repeatable creator, media, merchandising, inventory, and fulfillment process?
Finding 5: Marketplace expansion is an operating decision
Four cases include Walmart, and One Emerald Lane also includes eBay. Availability on another marketplace is not the same as a profitable channel. Expansion requires retail-ready content, marketplace-specific pricing, inventory, fulfillment, reviews, advertising support, catalog ownership, and enough management capacity to protect the original channel.
A reproducible profitability scorecard
The case-study sample does not produce a universal performance target, so the most defensible benchmark is a set of operating questions that every brand can calculate from its own data.
| Decision area | Minimum monthly view | Question it must answer |
|---|---|---|
| Contribution | Revenue minus product, marketplace, fulfillment, discount, return, and advertising costs | Which products and channels create or consume cash? |
| Advertising | Spend, attributed sales, total sales, ACOS, TACoS, and incrementality evidence | What demand did media create or capture? |
| Search and conversion | Query coverage, organic rank, listing or PDP conversion, and content gaps | Can shoppers and machine systems understand the offer? |
| Inventory | Days or weeks of cover, stockout risk, aged stock, and lead time | Should media or promotion change before inventory becomes a constraint? |
| Customer value | New customer mix, repeat purchase, subscription, retention, and payback | Does the first order build durable value? |
| Operations | Catalog defects, account issues, returns, deductions, and resolution time | Which operating leak can erase an apparent media gain? |
How brands should use this benchmark
- Open the case studies that match the brand’s channels and operating problem.
- Separate the documented work from the outcome and time period.
- Do not transfer one brand’s result into a forecast.
- Calculate the six scorecard areas from the brand’s own data.
- Assign one owner to every cross-functional decision.
- Use the same definitions when comparing internal teams, agencies, and software.
Frequently asked questions
Are these ecommerce industry benchmarks?
No. They are descriptive findings from 16 public Eva Commerce case studies. The sample is useful for studying operating patterns, but it is not random or representative of the whole market.
Why are there no universal ROAS or conversion targets?
Targets depend on category, margin, price, repeat purchase, inventory, channel role, geography, and growth stage. A universal target can reward the wrong business decision.
Which channel appears most often?
Amazon appears in ten cases, Shopify in six, TikTok Shop in four, and Walmart in four. Six cases include more than one channel.
Can another brand expect the same outcomes?
No. Each result belongs to its brand, period, category, economics, and engagement scope. The cases are evidence of work, not guarantees.
Explore the complete case-study library, use the commerce growth glossary for consistent definitions, or review Eva’s full-service management capabilities.